


State of the Internet, Q1 2015
Wednesday’s Internet events illustrate the importance of the Akamai “State of the Internet” quarterly reports. Because of failures at the New York Stock Exchange, United Airlines, the Wall Street Journal and false reports of an attack on St. Louis Missouri, there was a lot of buzz early in the day about some sort of Chinese assault on America’s Internet infrastructure. Salon suggested that claims by Anonymous that they’d taken down the stock market were believable, but they turned out to be baloney; NYSE simply rolled out some buggy software Tuesday night, United had a router go down, and the Journal messed up some HTML that affected desktop browsers only.
The fake attack on St. Louis is more interesting, but you’ll see why if you Google “St. Louis cyberattack” and look at the history of such claims. The underlying cause is that the security firm making the report, Norse Corp, was started in St. Louis so they have more honeypots there than anywhere else. Consequently, they’re constantly claiming that China is attacking St. Louis when there’s no reason to do that unless they’re Astros fans, which seems unlikely.
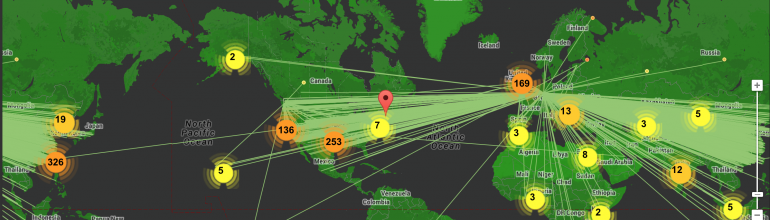
So this raises the common questions about cyberattacks in general: Where do they come from, how to they work, and how common are they? This is where the Akamai report comes in handy. It turns out there are several varieties of attacks launched from different sources for different reasons. The gaming sector is the most popular target of Denial of Service (DDoS) attacks, probably because gamers like to attack each other and because the shadier gaming sites can’t exactly turn to law enforcement for help. A common gaming attack is “booting,” where one gamer forces another out of the game. You can get a real-time visualization of attacks by clicking on the following image.
Akamai Global Map of Attack Traffic
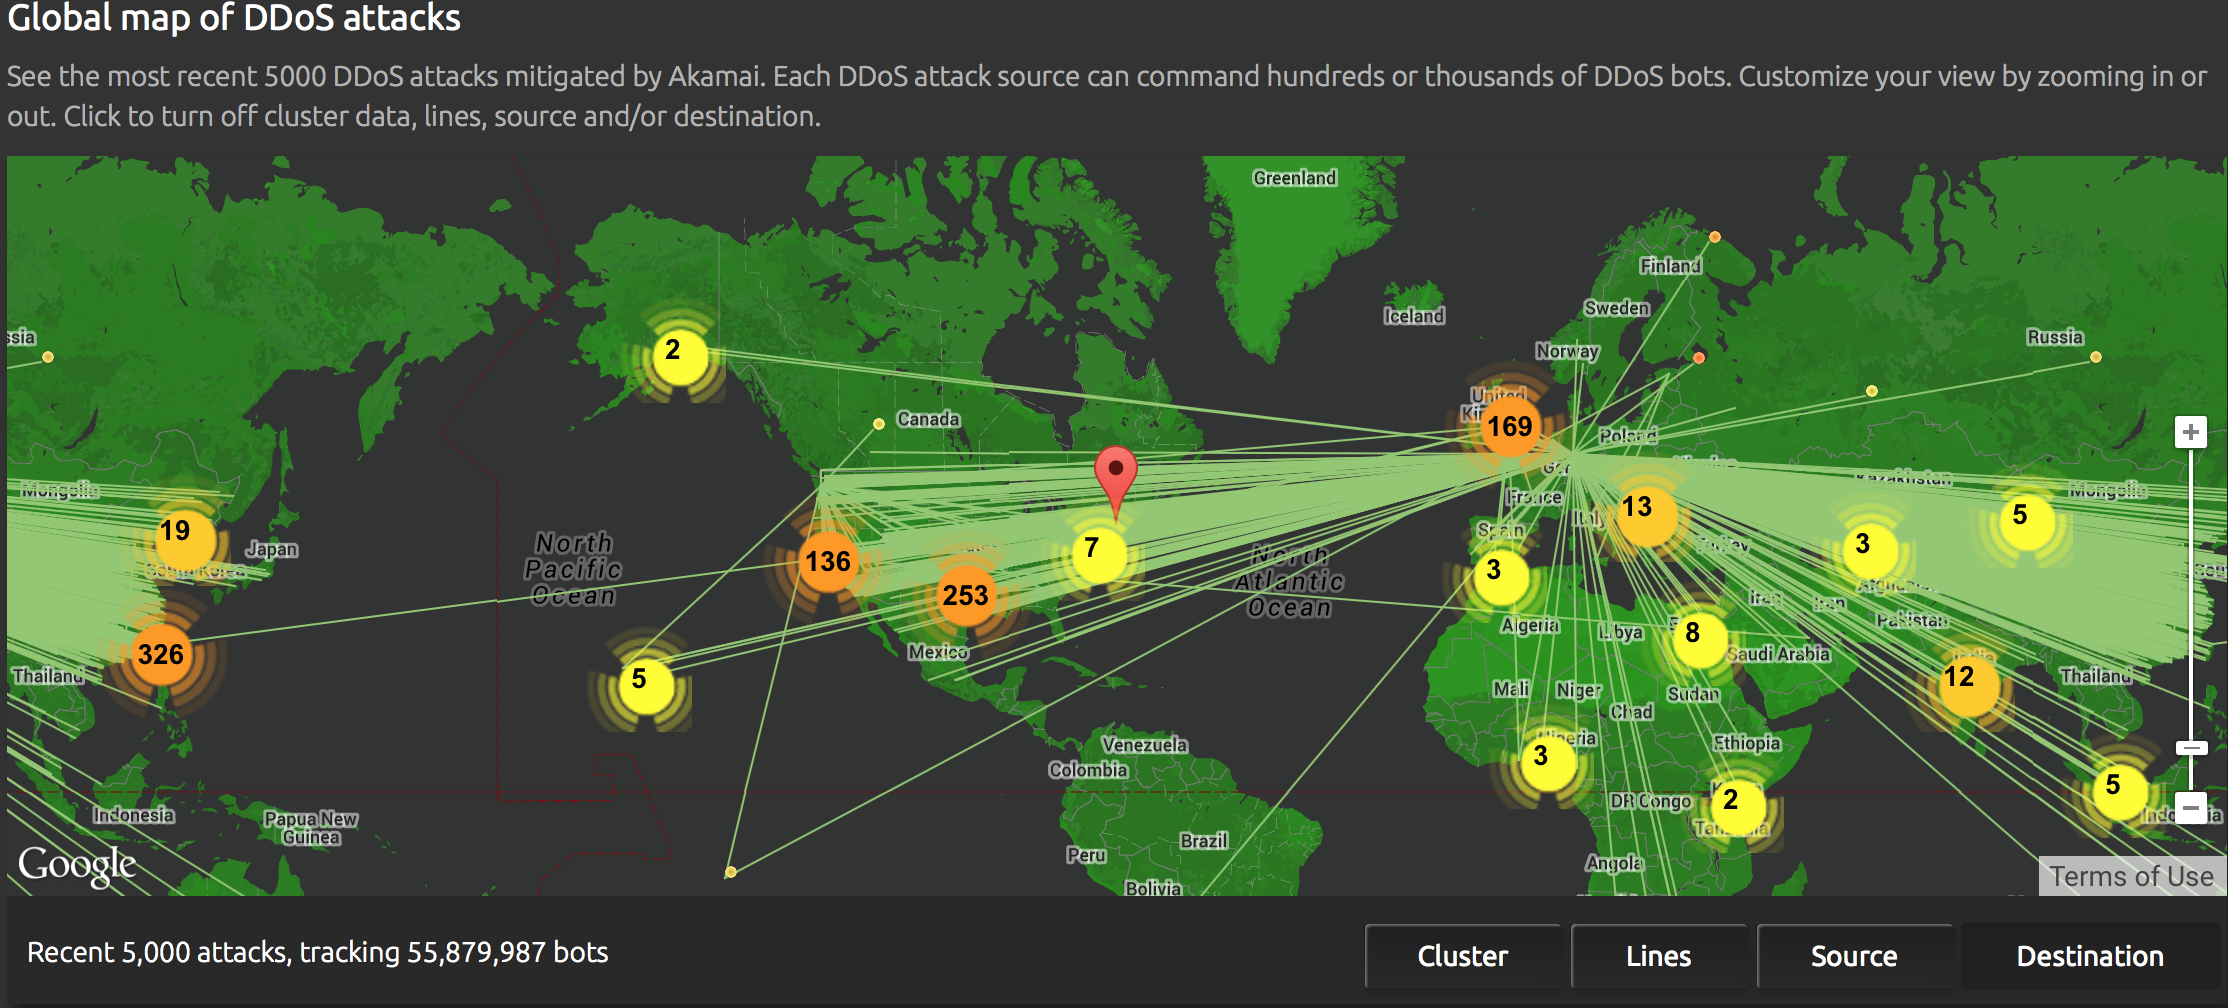
It only takes a few gigabits per second to accomplish a DDoS attack, easy to come by from “DDoS for hire” businesses who represent themselves as network stress testers; they use botnets of virus-infected computers to do their bidding. At the far extreme, Akamai found eight “mega-attacks” over 100 Gbps, with the highest at 170 Gbps.
Mega-Attacks Against Akamai Customers
170 Gbps seems like a lot, but with increasing numbers of residential Internet connections providing upload speeds of a gigabit, it’s only necessary for the DDoS for hire merchants to compromise a few hundred computers to launch a high volume attack. Yes, there’s a downside to the widespread deployment of extremely fast Internet connections without serious vigilance.
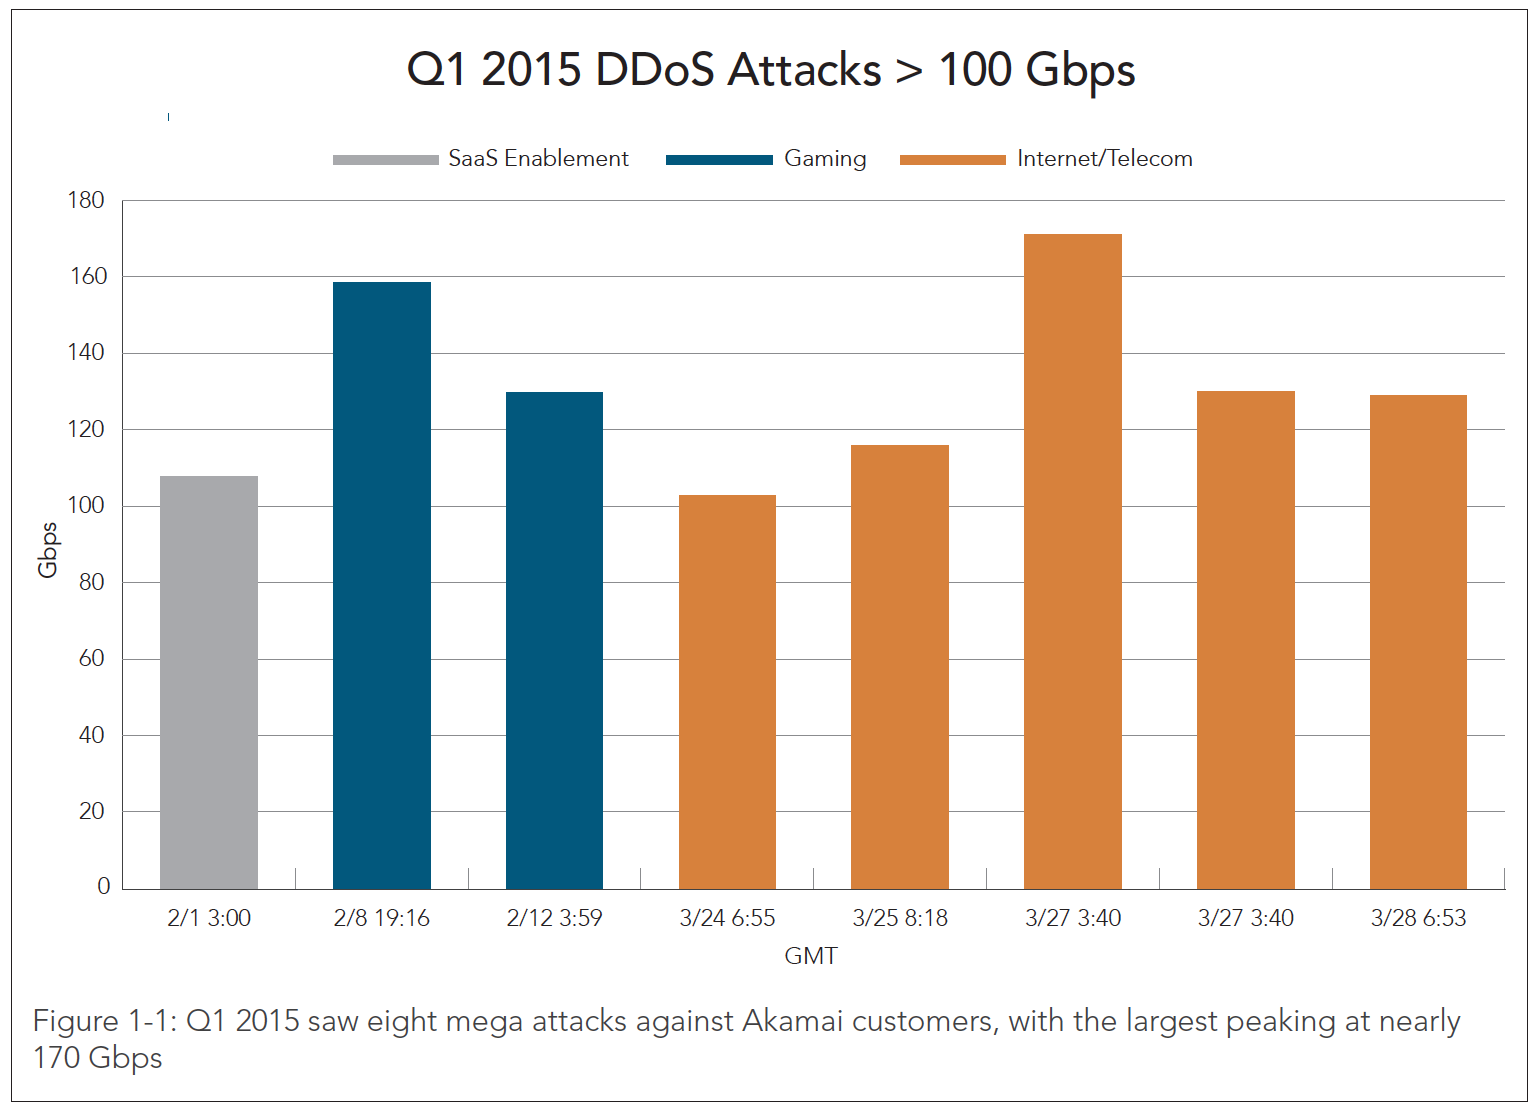
Conventional wisdom holds that attacks mostly come from China, but this isn’t really true. While China did lead the list of attack sources in Q1 2015, this is the first time they’ve held the top spot; the good ole USA has always been the leader in the past. Maybe the US really is falling behind.
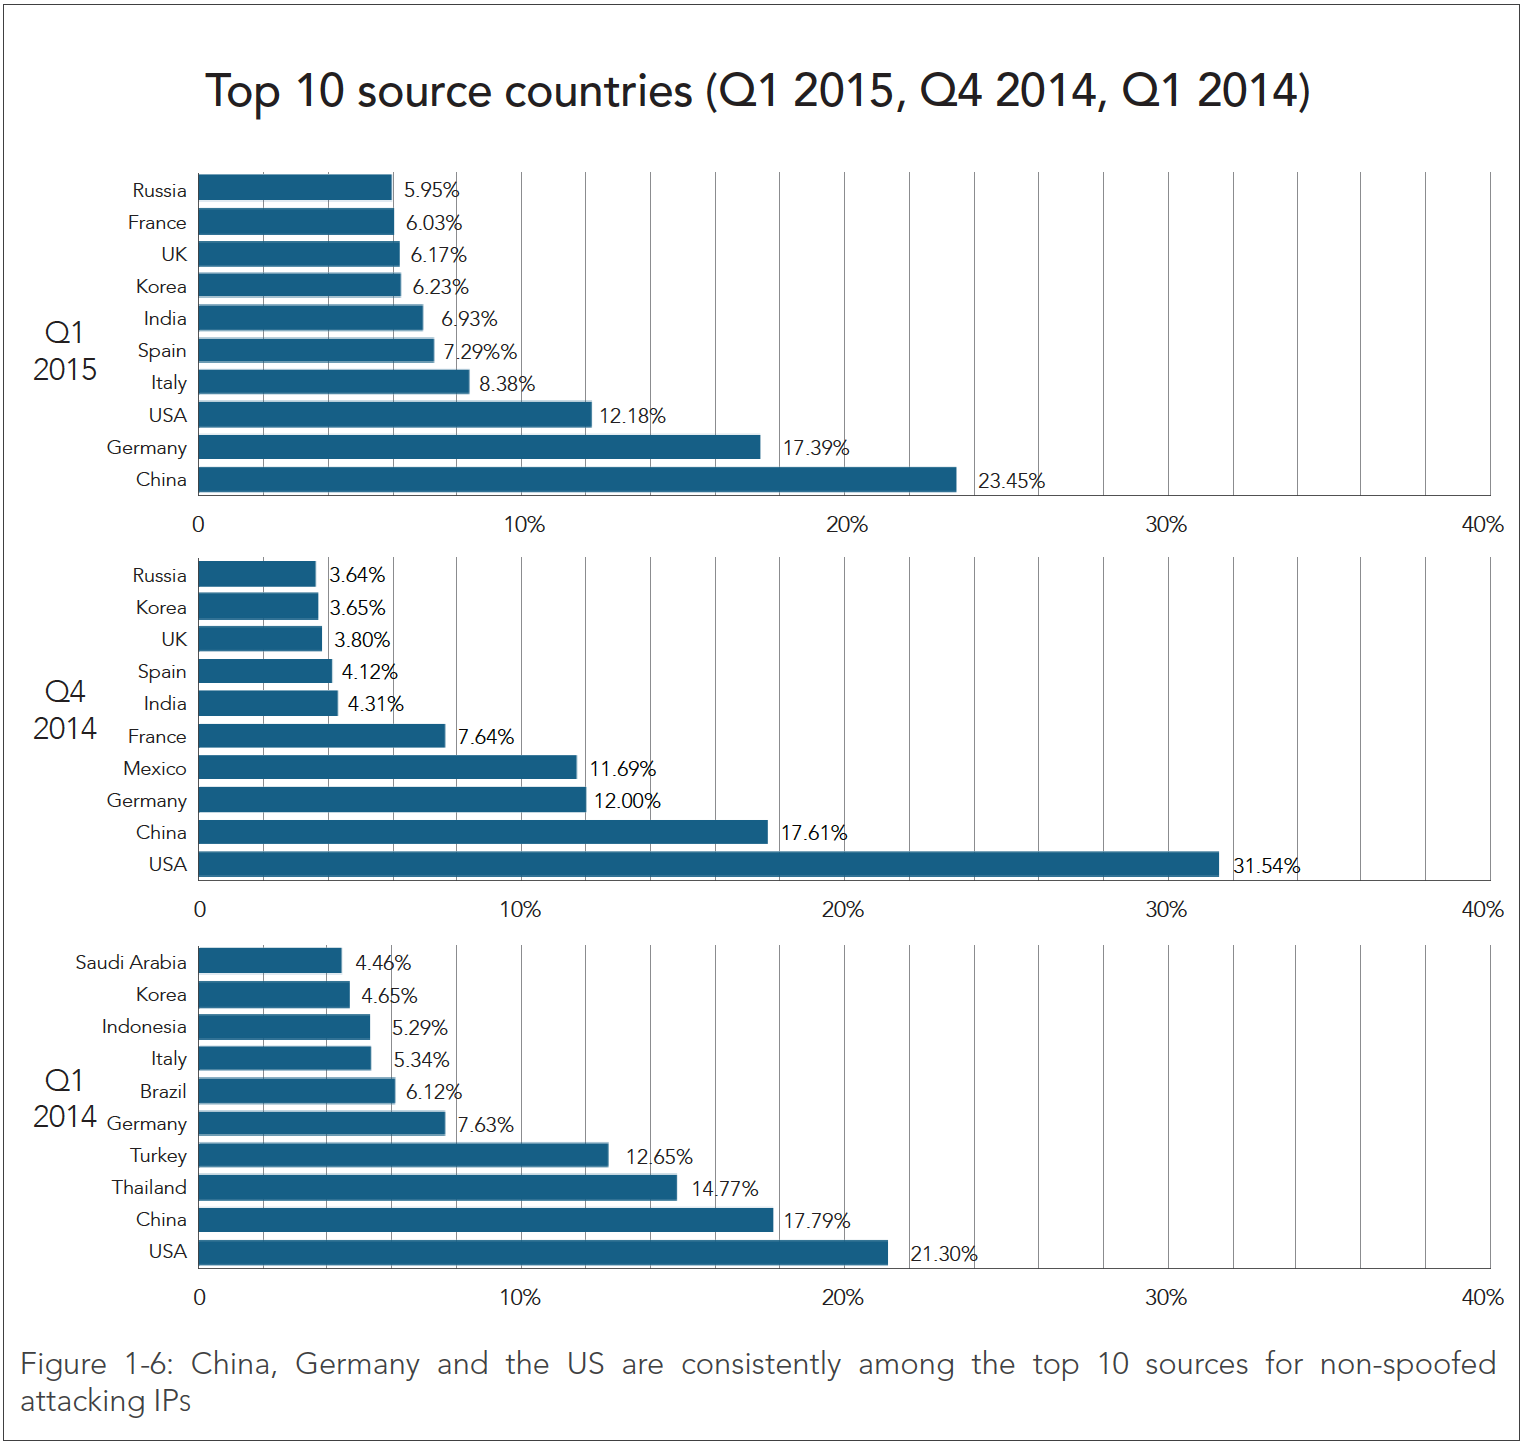
Leading Attack Sources. Source: Akamai
Web application attacks are different from DDoS attacks: instead of simply burying a site under tons of traffic, a web application attack is about breaking in so the attacker can grab some credit cards or other valuable information. The US is still the undisputed leader among attack targets, and we’re also the number one source, which may be why other countries are so indifferent about Internet attacks. The retail sector is the most popular target for these attacks, probably because of the credit cards and lax security compared to banks.
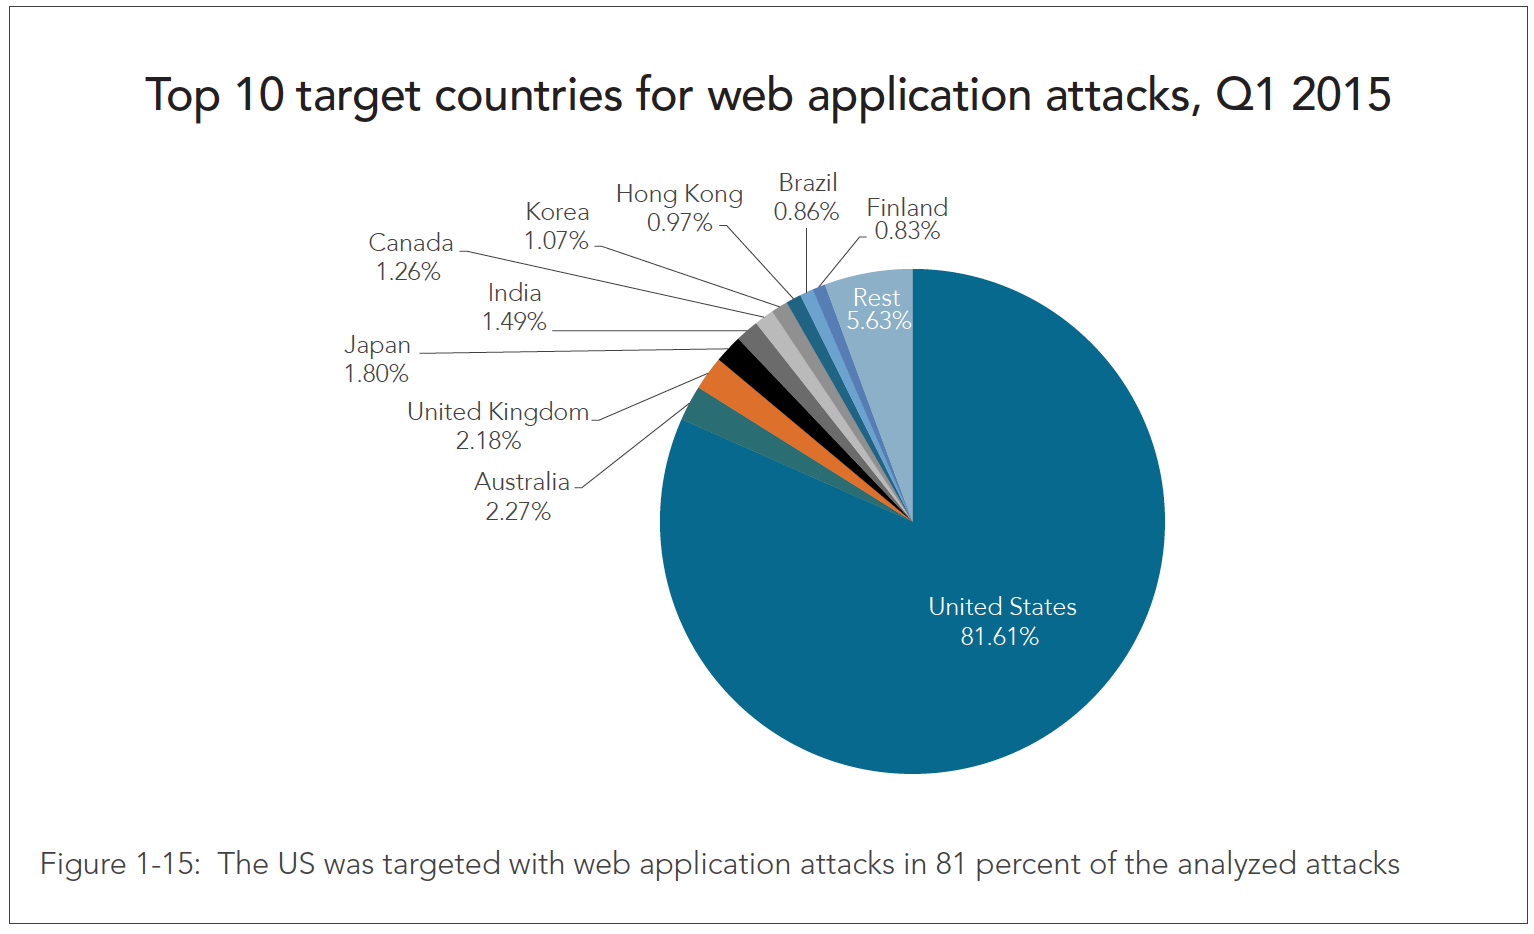
Web Application Attacks. Source: Akamai
Akamai also shows that neither IPv6 nor HTTPS is immune from attack; read the report for that.
The top attack vector in Q1 – this changes all the time – is an unofficial web protocol called SSDP that was devised by HP, Microsoft, and Intel in the late ’90s. SSDP was presented to the Internet Engineering Task Force, but never completed as a real standard. Particularly telling in the proto-RFC for SSDP is the required statement on security:
10.  Security Considerations

   TBD.
Oops.
The promoters of SSDP didn’t think security was any big deal because it was intended for small networks in homes and small offices. Its main use was for things like your printer telling your PC that it was there and ready to print. So it ignored security, shipped out the door in millions of home routers and consumer devices, only to become the biggest attack point on the Internet 15 years later. SSDP was part of something called Universal Plug and Play (UPnP) that I worked on for a bit in the early ’00s. I had issues with other parts of the program and didn’t stick with it, but I can’t recall much problem-solving around the security issues.
The security report is now a separate document from the connectivity part of “State of the Internet”, the source of the download figures I write about all the time. There are no big surprises in the connectivity report beyond IPv6 adoption. In terms of adoption, Belgium is the world leader, followed by Germany and the US.
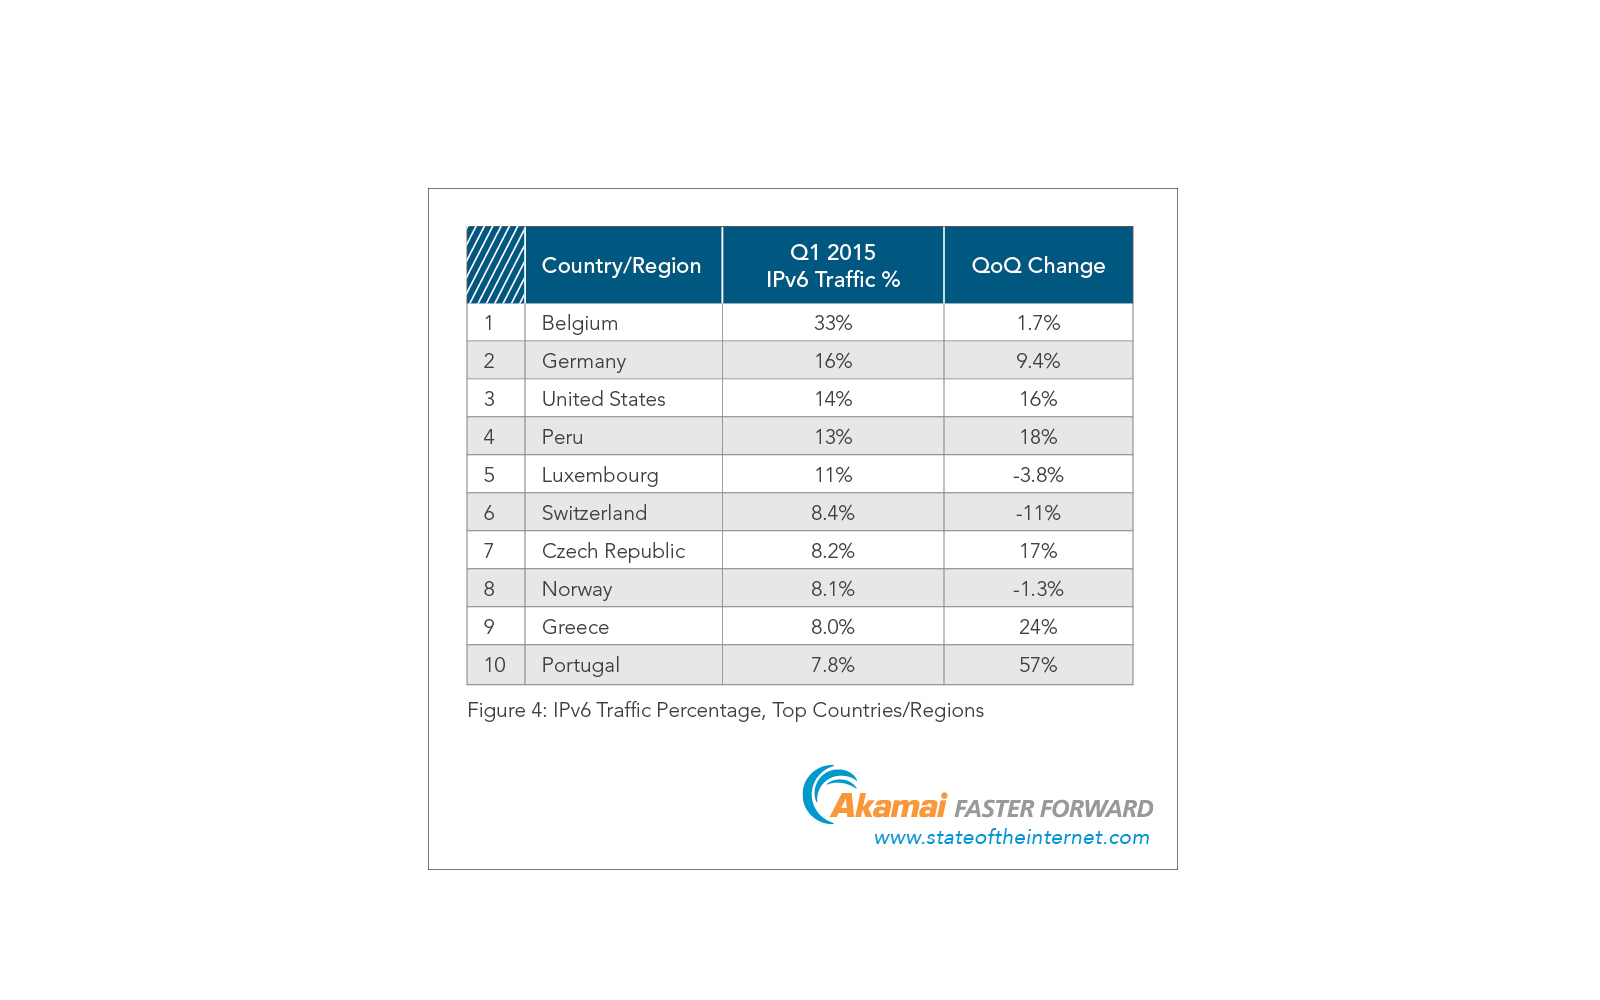
IPv6 Adoption by Data Volume
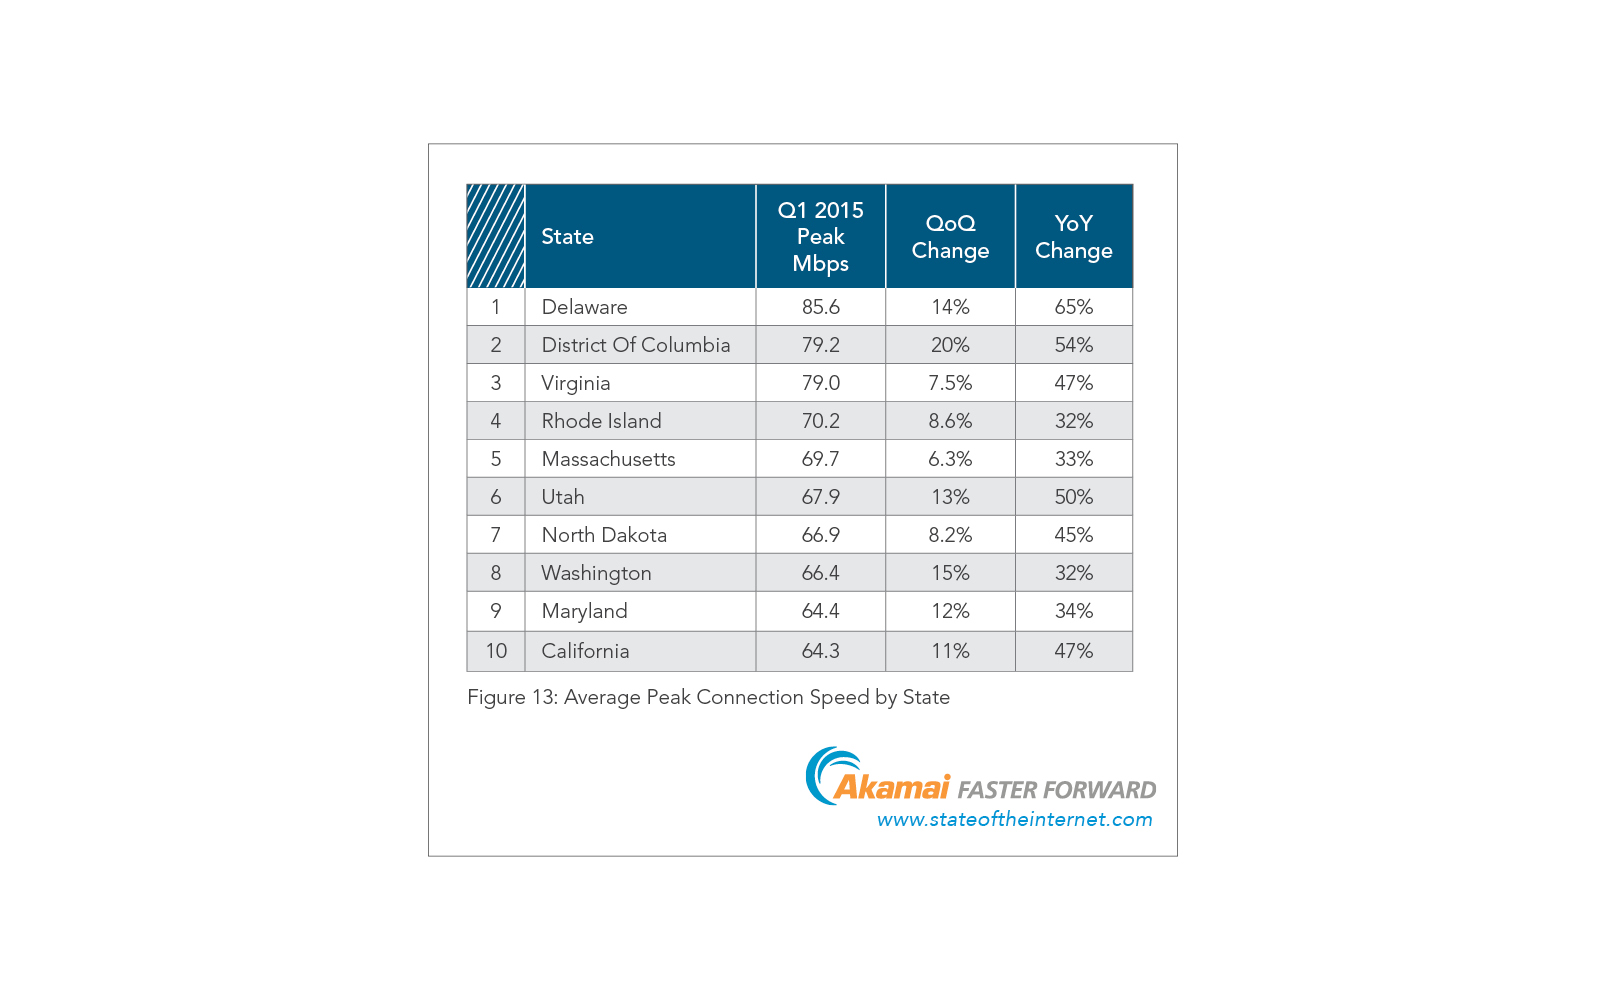
In terms of US states, Delaware has the best broadband speed this quarter with an average peak (Akamai’s measure of broadband capacity) of 85.6 Mbps. If Delaware were a country, it would rank 3rd overall, behind Singapore and Hongkong.
In overall global ranking, Singapore retains the lead with an average broadband capacity of 98.5 Mbps. I expect the island nation will be the world’s first to break the 100 Mbps barrier, which is kinda cool since I consult with them from time to time.
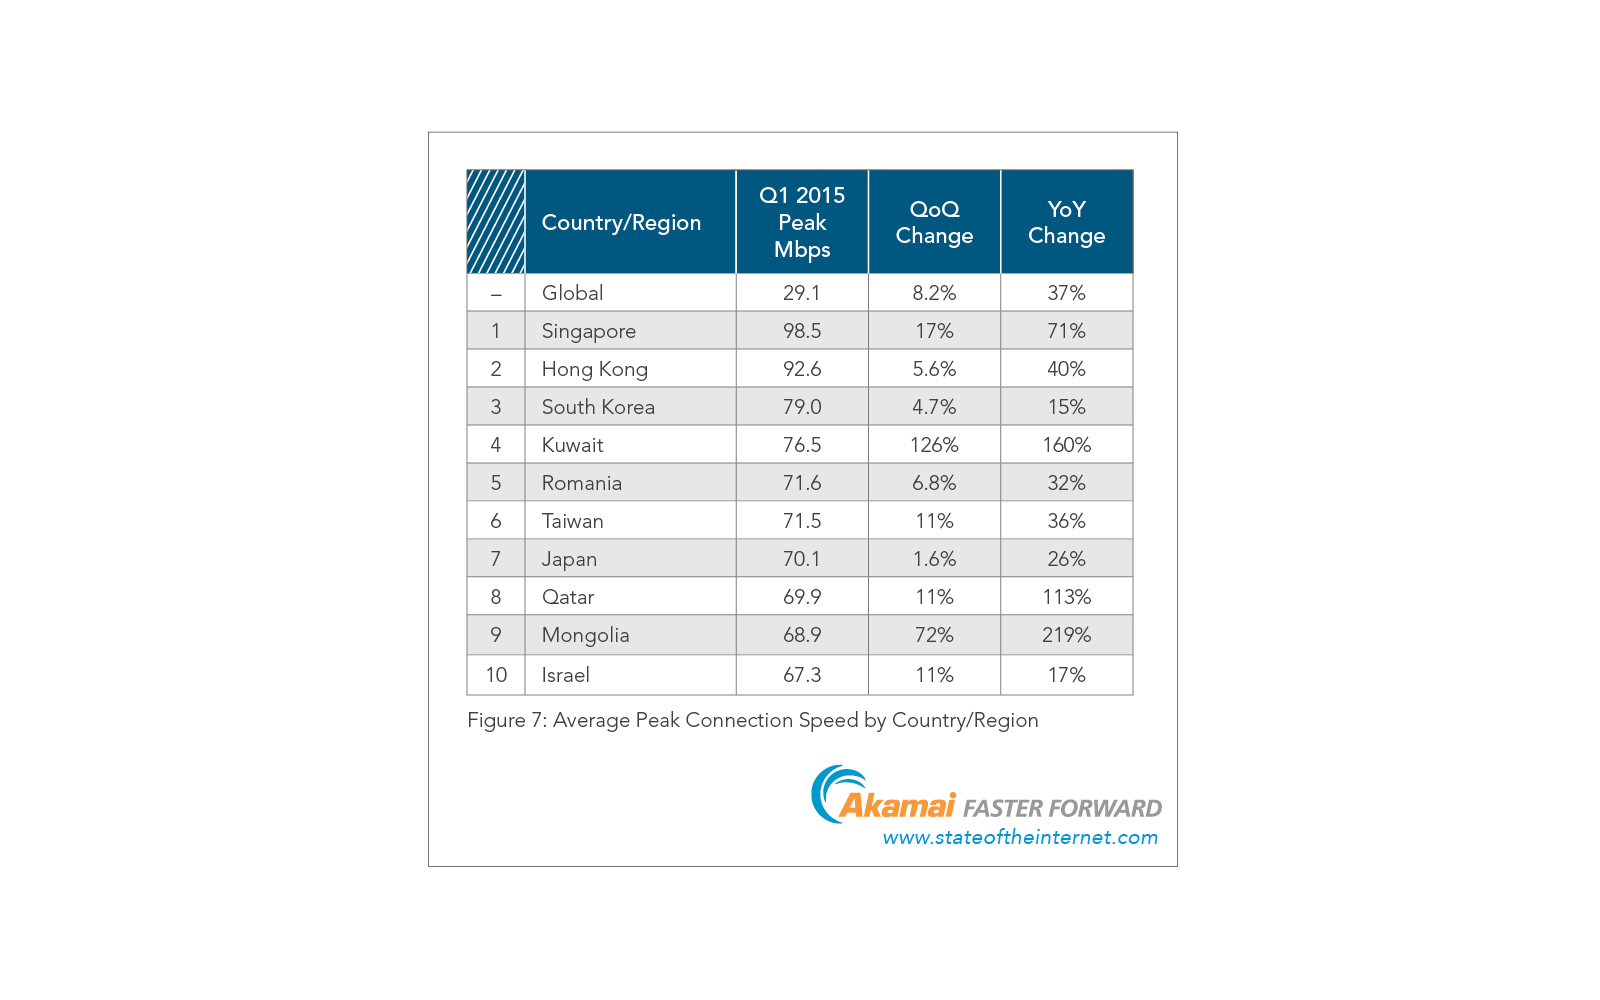
Global Broadband Leaders
If we rank US states and foreign countries on the same scale, this what we get:
1. Singapore
2. Hong Kong
3. Delaware
4. Washington, DC
5. Korea and Virginia (tie)
7. Kuwait
8. Romania
9. Taiwan
10. Rhode Island
Sometime world leader Japan ranks 11th.
On its own, the US ranks 22nd globally, with an average broadband capacity of 53.3 Mbps, best in the Americas and up 31% from a year ago.
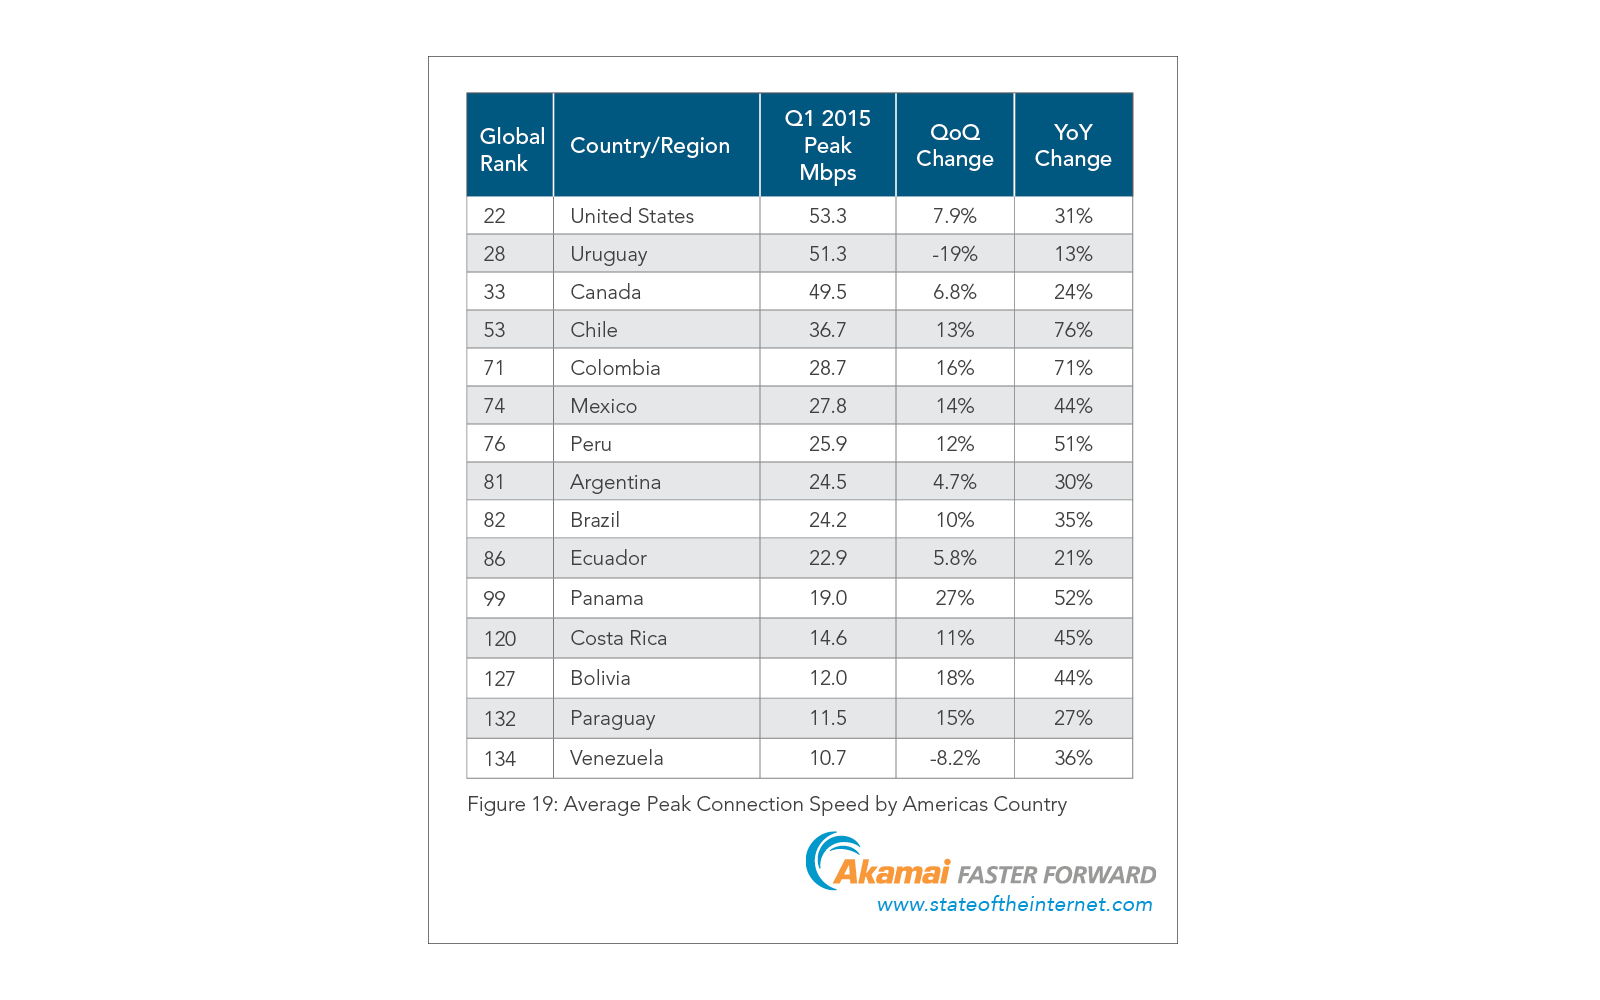
Top Broadband Capacities in the Americas
Because it’s not reasonable to compare small countries to big ones and urban countries with suburban ones, I like to compare the nations in the G7 with each other. When we do that, we see the same pattern we always see:
- Japan
- United States
- United Kingdom
- Canada
- Germany
- France
- Italy
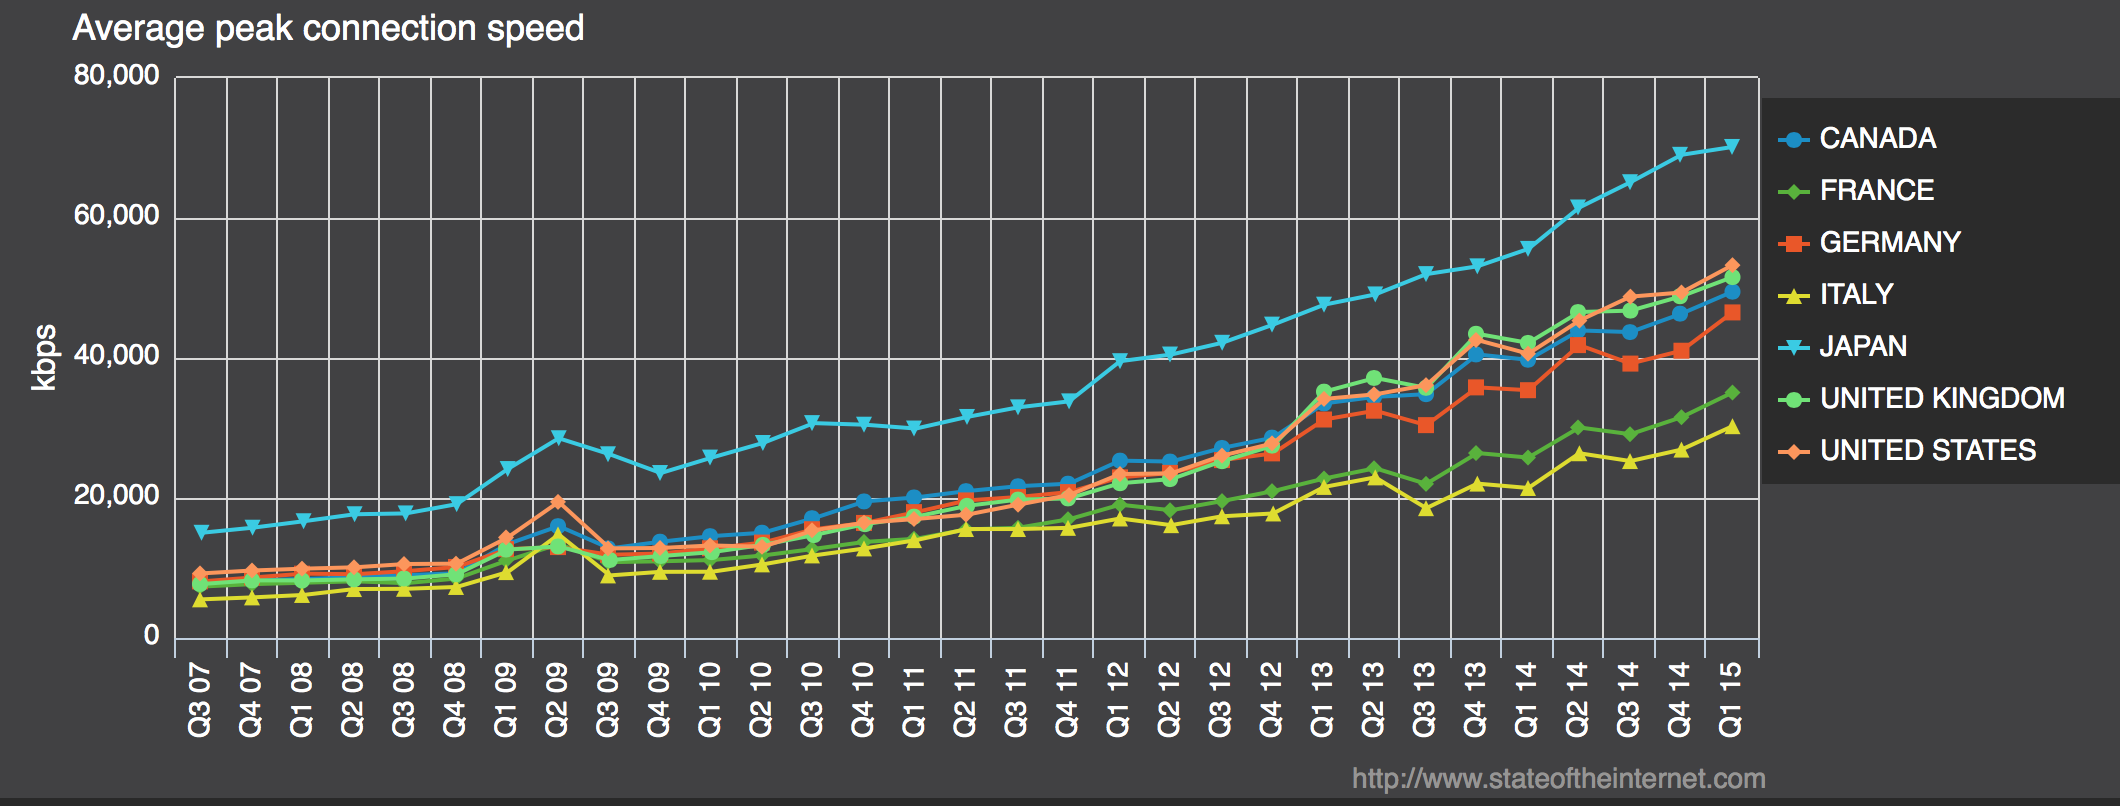
G7 Broadband Speeds. Source: Akamai
To sum up, attacks are growing and becoming more clever; IPv6 is catching on, especially in the US and Western Europe; and global broadband speeds continue to rise at a rapid rate, especially in small, densely populated areas. Now you know the State of the Internet.