


Populists Want FCC to Probe Broadband Prices
 The populist wing of the Democratic Party is making trouble for FCC Chairman Tom Wheeler by asking for a survey of broadband prices across the US:
A group of US Senators led by presidential candidate Bernie Sanders want the USA’s broadband regulator FCC to investigate whether Americans are being overcharged for internet access.In a letter (PDF) to FCC chairman Tom Wheeler, Sanders (I-VT), along with Senators Elizabeth Warren (D-MA), Al Franken (D-MN), and Ed Markey (D-MA) ask that the watchdog looks into the monthly charges being issued by service providers.In the missive, the Senators worry that the lack of competition amongst service providers is allowing cable and phone companies to raise the charges for service without any fear of losing business.
Wheeler promised not to regulate broadband prices, but what’s the point of bemoaning limited competition and high prices unless there’s legislation afoot to solve the problem? But I don’t want to talk about politics, the Register has it covered.
The question the Senators’ missive raises for geeks is how to measure broadband prices, because it’s not as obvious as you might think. The Senators ask for a very simple study that won’t tell us much:
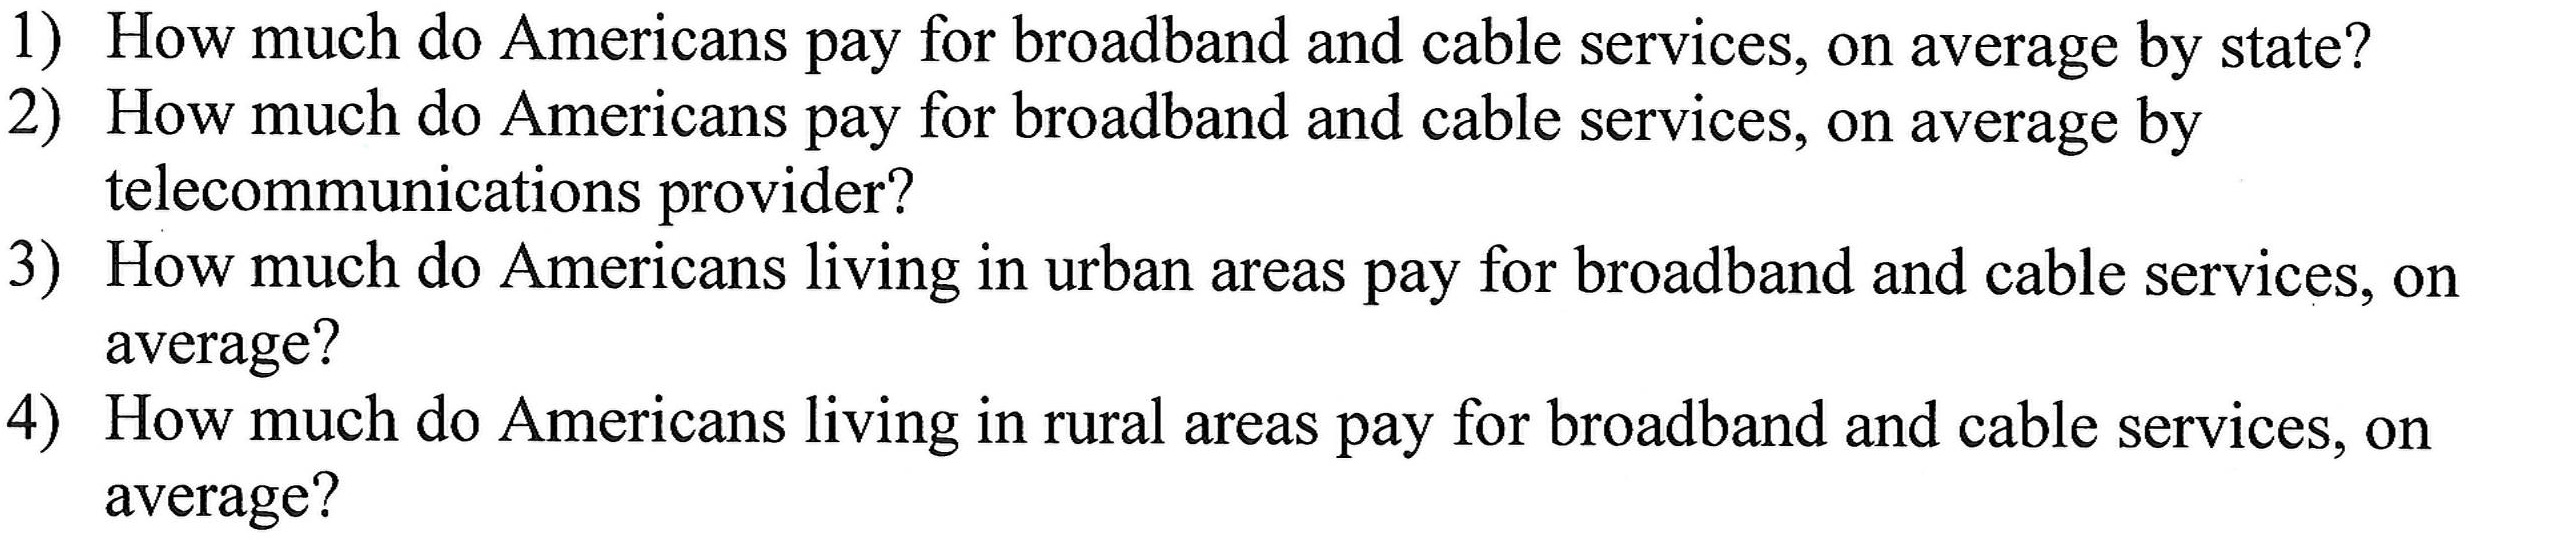
The thing that jumps out is the absence of any qualifiers about service tiers, usage limits, and housing density. Speed, volume, and distance are, after all, the major determinants of cost, and cost is the major determinant of consumer prices. The urban/rural distinction suggests some sensitivity to distance, but it’s about as rough as it can get. And similarly, price by provider suggests something about speed, but not enough to be meaningful because they all offer a range of services.
Let’s see what kind of service consumers are buying in the Senators’ home states by Akamai’s Average Peak Connection Speed, the best clue about broadband capacity.
- Massachusetts residents enjoy 69.7 Mbps, fifth best in the nation.
- Minnesota has 55.7 Mbps
- The national average is 53.3 Mbps
- Vermont lags the national average at 50.9 Mbps.

Relative broadband capacities in Massachusetts, Vermont, and Minnesota
All of these states have one thing going for them that tends to increase the adoption of high-speed broadband plans: nasty winters. There’s nothing like a blizzard to make you stay inside looking at cat videos. But bad weather also increases maintenance costs for telecom networks, so high demand is offset by high intrinsic costs.
Another factor that influences broadband price is data volume, because equipment and transit costs are volume sensitive. This is obvious in cell phone bills, but less clear for wired services that tend to have no data limits or limits so high that few people reach them. Data limits can be an issue for DSL homes with multiple teenagers (the gaming and Netflix audience), but speed is an even bigger issue in that scenario.
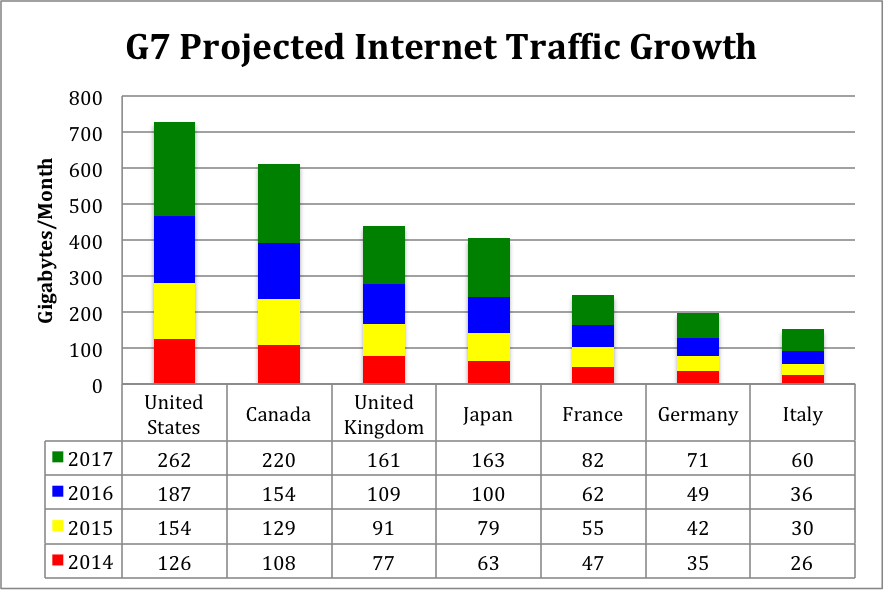
Projected Internet Traffic in Gigabytes per Household per Month
Sources: Cisco; World Bank, “Population (Total)”; and NationMaste
Distance from the nearest Internet Exchange is also a big cost factor, and Massachusetts has it all over the others because there’s an exchange in Boston. Vermont connects to the Internet in Boston or New York, so costs will be higher. Minnesota has a small exchange in the Twin Cities, but most of its traffic goes to Chicago or Dallas to meet other networks.

Rural Area Served by Each Internet Exchange Point in Nation or Nearby
Sources: Author’s calculations from World Bank, The Little Green Data Book 2011; and Aemen Lodhi et al., “Using PeeringDB to Understand the Peering Ecosystem”
One of these days, a clever economist is going to develop a formula that predicts broadband prices by speed, volume, and distance; it may find that competition is a major factor as well, and will probably find pole attachment/conduit fees, local taxes, and weather-related maintenance are significant. But until we have that sort of a model, pricing figures don’t mean an awful lot.
There’s also the question of the FCC’s expertise in price comparisons. The only part of the FCC that has history here is the International Bureau, and they tend to use the “scan the web for ads” method used by New America’s Open Technology Institute. This method reeks of bias and has no controls for cherry picking.
The EU pays professionals to conduct end-user surveys to establish price comparisons, and they find the US has lower prices than Europe for lower speeds and higher prices for higher speeds. But the US also has greater availability of higher speeds, since only half of Europe has access to cable.
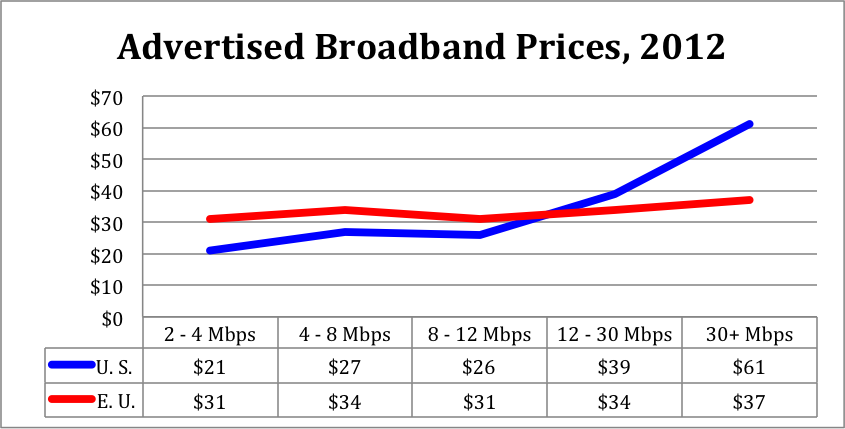
Broadband Prices by Speed, US and EU, 2012 Source: Van Dijk Management Consultants, Broadband Internet Access Cost.
And there’s also the bundling question; broadband is usually sold as part of a triple play package in the US, along with a TV package that’s 2 – 4 times more valuable than TV in other countries. So how do you address that?
I suspect the FCC will refuse to conduct the survey, and if they do go forward with it there will be a lot of questions about their methodology.
[Note: The charts here come from my international broadband study, “G7 Broadband Dynamics: How Policy Affects Broadband Quality in Powerhouse Nations“.]