


Faster Internet up to Web Sites
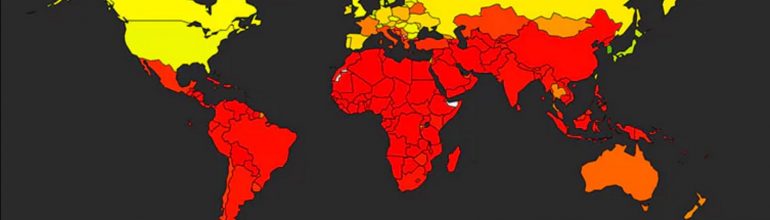
Akamai’s quarterly State of the Internet report is one of my favorite publications. It’s mostly data, some of it tricky, and anecdotes about broadband infrastructure projects around the world. Not only does it cast light on how the Internet is today, it provides most of the information we need to know how it’s going to be in the future.
The most recent edition of SOTI, covering the 4th Quarter of 2016, includes the usual information about “connection speeds” (more on that later) for wired and mobile networks, disruptions, the IPv6 transition, and web page load times. This edition unfortunately didn’t include the “Average Peak Connection Speed” measurement that tells us the most about broadband network speeds, but it has all the other data.
How Akamai Measures Speed
Akamai ranks nations and regions in terms of average connections and higher-speed network adoption. The most commonly-cited metric is the “Average Connection Speed”, which many journalists and advocates mistake for an “average broadband speed.” In fact, ACS measures the speeds of TCP connections, which are not the same thing as the broadband networks that ISPs sell according to overall capacity.
Browsers typically uses multiple “connections” in parallel, all running over a common broadband network. When you load a web page with the Chrome browser, for example, it will open 6 connections at a time for any given domain, and an additional 4 for page elements that come from different domains from the main web page.
Ad networks are typically run from their own domains. So browsing the LA Times will consist of six connections at a time from the browser to latimes.com and additional connections to sites like doubleclick.com where the ads come from.
Consequently, the average connection speed will be a relatively small fraction – a third to a fourth – of your broadband speed. That’s because these connections compete for bandwidth on your broadband network.
National Speed Trends
This means that nations like South Korea, where average broadband speeds are 100Mbps, show an “average connection speed” of 26.1Mbps. The nations with the highest speeds are densely populated areas with small populations: South Korea, Norway & Sweden, and city states Hong Kong and Singapore. [Yes, Norway and Sweden are large, but most of their land masses are uninhabited.]
I like to compare the nations in the Akamai survey to US states since the land masses and population densities are most comparable. This is not a perfect comparison because the US states with the highest speeds are very small in comparison even with small nations like Singapore: the District of Columbia has less than a million people, while Singapore has 5.5 million.
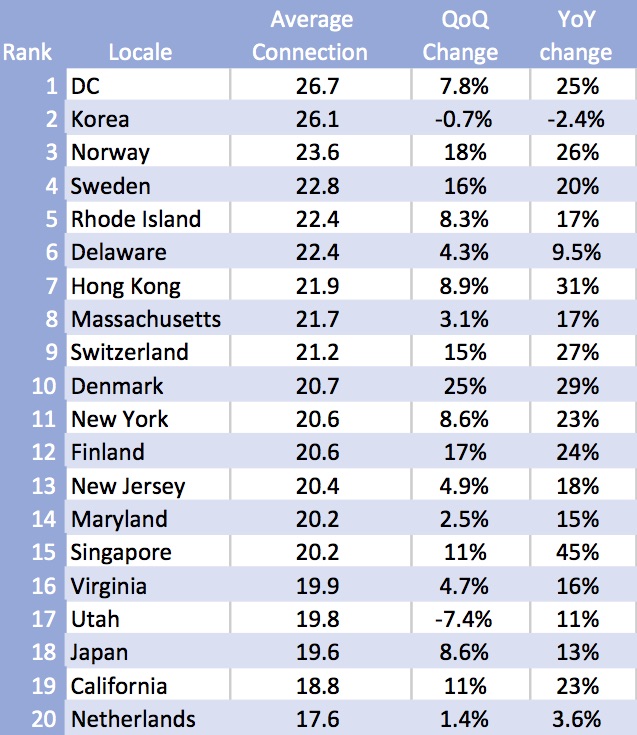
Top Twenty Nations and US States. Source: Akamai State of the Internet, Q4 2016
But Massachusetts, the fourth fastest US state, has 6.8 million people, so we’re in the ballpark. New York and California are among the US top 10, and they’re not small states. So here’s a chart that merges the ten fastest US states with the ten fastest nations.
We’re doing fine at this high level. The overall average US connection speed is 17.2Mbps, up 5.5% over the previous quarter and up 21% over the previous year. The fastest nation, South Korea, is actually down from both the previous quarter and from the previous year. That almost never happens in the US.
US Developments
The US has some major broadband upgrade projects going on. While Google has lost interest in wired networks, cable companies are going full steam ahead with upgrades to their networks based on DOCSIS 3.1:
Comcast stated that, beginning in early 2017, it would offer such services to cities in California and the Pacific Northwest, as well as Denver, Salt Lake City, Kansas City, Indianapolis, Knoxville, and Jacksonville. Mediacom revealed that its entire network footprint would be gigabit-capable by the end of 2016. RCN announced it would launch DOCSIS-powered gigabit services in Chicago and New York City. Altice USA introduced gigabit speed services in New Mexico and Texas. Pushing the speed envelope further, Charter Communications’ CEO alluded to working toward a 10 Gbps broadband service that he claimed could be built “at fairly low capital investments” using the Full Duplex extension to DOCSIS 3.1.[Akamai SOTI, page 20]
Telcos aren’t standing still either:
AT&T expanded its fiber-based gigabit service (now branded “AT&T Fiber” instead of “GigaPower”) to 17 new metropolitan areas, for a total of 46 markets, with plans to reach 21 more by mid-2019, and regional provider MaxxSouth Broadband launched gigabit fiber-to-the-home (FTTH) services in Oxford, Mississippi.[ibid.]
Not noted in the report but still relevant, Verizon announced a billion dollar fiber buy and pending gigabit service in several markets.
Surprising International Developments
Kenya has emerged as a major broadband powerhouse among LDCs with an average connection speed of 15 Mbps, up 36% from the previous quarter and a whopping 198% from the previous year. This improvement moves Kenya ahead of Israel and into the top spot in the Middle East and Africa.
The Kenya project is fueled by several parallel developments:
Kenya’s broadband market has been transformed by a combination of increased investments in network upgrades among the key providers as well as the landing of four fibre-optic submarine cables. This international connectivity ended the country’s dependence on limited and expensive satellite services, while vastly increased bandwidth has led to wholesale prices tumbling to a fraction of the former rate. The development has helped make broadband services affordable for the mass market, while also providing the key backhaul network for the burgeoning mobile broadband sector.
Lower international connection costs and higher speeds have fueled a number of projects in both urban and rural areas. Akamai has contracted to provide cloud services in the Kenya Internet Exchange, rural projects using Wi-Max are underway, and Facebook’s Internet.org is allowed to operate without restriction (take note, India).
National Web Trends
Web page load times don’t mirror broadband speeds. The Akamai measurement system for load times is being revised as the data aren’t as reliable as they’d like. But they serve to demonstrate that web page performance isn’t solely determined by network speed.
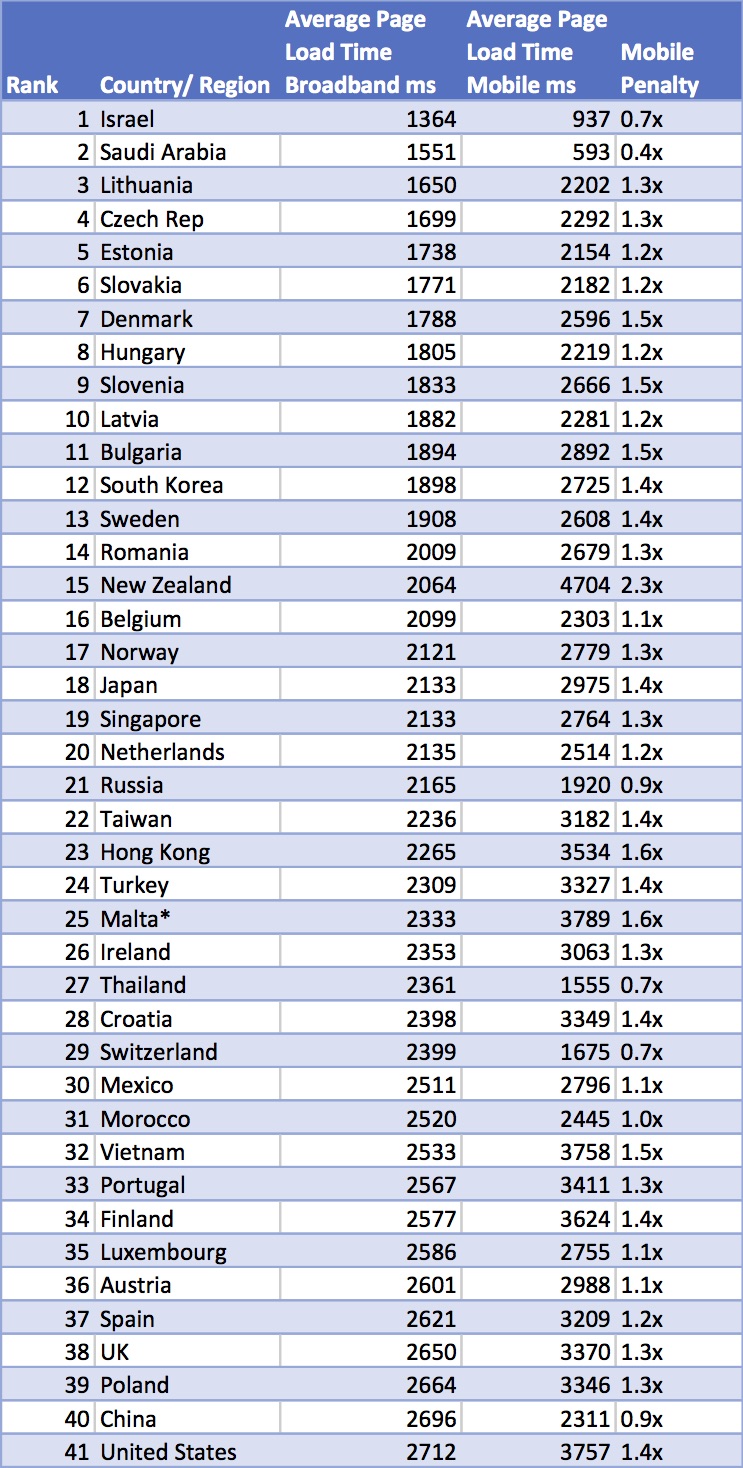
Web Page Load Times. Source: Akamai State of the Internet, Q4 2016
Israel has the fastest load times for wired networks and Saudi Arabia is the leader for mobile. Neither country is anywhere close to number one in the network speed rankings, but web page load time is determined by many factors. The proximity of the web server, performance constraints on web servers, and the structure of web pages all play roles.
As the following chart shows, the US ranks 42nd in web page load time on wired networks at 2.7 seconds per page, despite standing 14th in average connection speed. Israel’s average is 1.4 seconds, despite its pedestrian connection speed. More surprising is the fact that Saudi Arabia’s mobile page loads are the fastest in the entire survey at 593 milliseconds. That’s lightning fast even though mobile pages are smaller and simpler than ordinary ones.
What’s Going on with Web Pages?
It turns out America’s web sites are poorly designed and under-provisioned. For a quick look, I compared the performance of the Jerusalem Post to that of the LA Times. Using a test tool called Web Test, I loaded the LA Times from test client in Denver and the Jerusalem Post from the UAE.
In this test, the LA Times was “visually complete” in 48.7 seconds while the Jerusalem Post hit the same threshold in 13 seconds. The two pages had comparable numbers of trackers: 53 for the Times and 57 for the Post. But the LA Times page issued 623 web requests, mainly to tracking networks, while the Post made do with 202. The ratio of requests to each other is close to ratio of the “visually complete” times for the two pages.
This suggests that there’s only so much a network can do to make up for the performance of poorly designed web sites. When we think about Internet performance we need to understand the problem holistically.
The ISP can take traffic from a server to a user as fast as the speed of light, but if the web server is underpowered or overloaded with badly written tracking code, the user isn’t going to be happy.
I’ll be looking at other web pages to see how widespread the bad practices used by the LA Times are in the American Internet. I didn’t expect to see what I saw, so it’s quite shocking.
To learn more about Akamai’s State of the Internet reports, check out our podcast with David Belson, the report’s author.