


Community Broadband is Cheaper – and Slower

A recent study from the Berkman Klein Center for Internet and Society at Harvard shows that publicly-funded broadband networks are cheaper – but slower – than those built with private capital. On average, consumers who buy broadband service from a government provider pay $10 per month less than those who patronize commercial providers, but their download speeds are close to 7 Mbps slower, 42.59 Mbps to 49.12. That’s 15%.
The study claims community networks are “value leaders” because its analysis focuses exclusively on consumer prices, excluding both construction costs and speeds. But the actual data discovered by the researchers tells a very different story: government customers pay less simply because they get less. It’s not surprising that slower networks are cheaper, regardless of how they’re financed. (See this spreadsheet I’ve made from the Berkman Klein data for the raw data and the averages.)
The speed difference is substantial: consumers of public broadband are saving $10/month by giving up enough bandwidth to support two Netflix streams. But perhaps they don’t need it because all the network packages in the study are 25 Mbps or faster. The most bizarre feature of the report is its characterization of plans with average download speeds of 43 – 50 Mbps as “entry-level” plans.
The Case for Faster Networks Takes a Hit
The Berkman researchers are fans of community broadband, even in markets with two commercial suppliers of wired broadband, such as Longmont, Colorado, Morristown and Chattanooga, Tennessee, and Issaquah Highland, Washington. They like the fact that government networks don’t offer “initial low “teaser” rates” that rise down the road.
Their primary claim is that the $10 lower monthly rate offered by publicly-financed wireline networks will appeal to today’s broadband non-adopters. But they’re forced to admit that from two-thirds to nine-tenths of this group are deterred for reasons other than price. Where price is the issue, surely “teaser” rates are appealing.
International pricing comparisons have long shown that US prices for low-speed broadband are among the lowest in the world. These tend to be extremely slow offers, at or below 10 Mbps. If consumers are more interested in low prices than high speeds, perhaps it’s wise for government policy makers to stop sneering at lower speed broadband packages.
The Berkman Methodology Follows New America
The Berkman researchers – David Talbot, Kira Hessekiel, and Danielle Kehl – followed a methodology developed by New America Foundation (Kehl’s employer) for its “Cost of Connectivity” reports. Researchers choose a small collection of cities (24 in one NAF study, 27 in this one), obtain prices from easily accessible sources such as newspaper ads and company websites, and then draw comparisons favorable to government-funded networks.
This methodology suffers from a small sample size as well as selection bias. There’s no way of knowing whether the two dozen cities are representative of the whole picture. In this instance, cities were chosen for Berkman by Chris Mitchell, an advocate whose employer consults with cities on community network projects.
The researchers excluded wireless and satellite networks as well as service plans in the sub-25 Mbps range that generally provide consumers with the best price/benefit ratios. In fact, Berkman’s entire discussion of consumer benefit is limited to monthly bills averaged over a four year basis.
That’s a peculiar approach for consumer advocates. Its limited value may explain why NAF hasn’t published a “Cost of Connectivity” report since 2014.
Pitfalls to Avoid in the Berkman Study
Like the NAF studies, the Berkman study’s text fairly boils over with spin. Let’s highlight some of the more creative ways the authors try to avoid acknowledging the message the data itself conveys.
- First, the survey fails to include information about plans provided by AT&T, Verizon, and Time Warner Cable (now Spectrum) on the grounds that website terms of use prohibit its use or publication. But I can’t find any language in these TOUs that would discourage researchers. AT&T doesn’t want its site scraped by bots, but this was obviously a manual survey. Spectrum’s TOUs are virtually non-existent. The report claims Verizon has a restrictive TOU, but it doesn’t appear on Verizon’s website. This looks like a dodge.
- The survey found four cases in which the community network was more expensive than the commercial option and one where it was both more expensive and slower. I imagine the taxpayers who paid for the Churchill, NV network that offers 35 Mbps service for $25 more than Spectrum’s 60 Mbps offering are not very happy; the study offers no analysis of this situation.
- The survey claims: “8.9 percent of Americans, or about 29 million people, lack access to wired home broadband service” based on data found in the FCC’s Restoring Internet Freedom order. The link to the order is broken, which is a shame because of it’s worth reading for the nuance it provides:
FCC Restoring Internet Freedom Order, page 71.
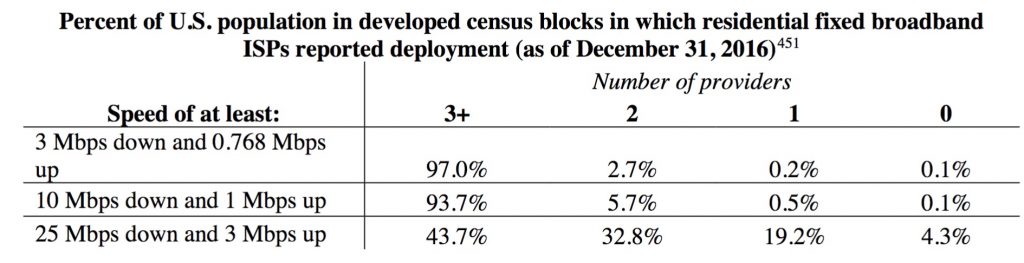
Expanding the mode from wired only to either wired or fixed (not mobile) wireless brings the percentage down to 4.3 from 8.9. Reducing the speed threshold from 25 to 10-24 reduces it even further to 0.1%. So context matters. If 9 percent of Americans can’t get broadband, our existing subsidy programs aren’t working. But a tenth of a percent gap is better than the wired telephone network did at its peak.
- The report focuses on FTTH networks on the assumption that “fiber will likely be the technology of choice for any new public or private networks…fiber requires the highest up-front investment and installation costs.” Many of us see 5G wireless as the technology of choice for both mobile and fixed residential broadband in the next 2 to 5 years. The exclusion of wireless technologies that perform as well as wired ones is an arbitrary move that distorts the data. In fact, new networks are underway that will offer up to 1 Gbps over 5G.
- The report’s focus on networks that support 25 Mbps or faster downloads is also arbitrary. The Wheeler FCC did define “broadband” as 25 down/3 up for public relations purposes, but nevertheless continued to subsidize 10 – 24 Mbps networks. If we follow the money we have to admit that even an FCC captured by Netflix behaved as if 10 Mbps were the real definition of broadband.
- The report’s conclusion doesn’t follow from the data:
Our study, though limited in scope, contains a clear finding: community-owned FTTH networks tend to provide lower prices for their entry-level broadband service than do private telecommunications companies, and are clearer about and more consistent in what they charge. They may help close the “digital divide” by providing broadband at prices more Americans can afford.
There is no meaningful comparison of alternatives to government network construction in the study. It is quite probably the case that subsidy programs that encourage non-adopters to use existing networks are more efficient at getting them online than building entire new networks that, at best, only address a third of the overall reason for non-adoption. And we’re too close to 5G to be spending taxpayer money on FTTH networks that have already lost their luster.
- There is no analysis of the customer service, reliability, and repair characteristics of public networks. Most of the consumer complaints about existing commercial network relate to these issues, so it would be extremely valuable to know whether government can do a better job. I don’t know the answer to this question, but if we extrapolate from our experience with the motor vehicle department and the tax collectors there’s not much basis for optimism.

In Conclusion
Journalists and bloggers were only too eager to tout New America’s “Cost of Connectivity” reports because their message was so simple and so appealing. Price-gouging complaints are the number one staple of consumer-focused journalism in all sectors.
But this report is so poorly done that it basically destroys itself. It would have been wise for the researchers to study Berkman’s Benkler report, “Next Generation Connectivity: A review of broadband Internet transitions and policy from around the world“, written for the National Broadband Plan. That report shows that the pricing strategy employed by US broadband suppliers is below the OECD average for lower speed plans and above it for higher speed plans (see figures 3.23 – 3.27).
It stands to reason that the response of broadband incumbents to price-based competition from government agencies that can offer service below cost would be to concentrate on higher speed offerings. Broadband, like most consumer goods, is either marketed on price or on quality. Oddly, the entry of low-price government networks into competitive markets probably serves to raise the overall price paid for broadband.
But it will take another study to prove that.
UPDATE: The study says municipal networks are up to 50% cheaper than commercial ones, a point that has been picked up by the troll blogs. But the study’s data also says commercial networks are up to 30% cheaper than munis. Turning to speed, the study data says commercials are up to 150% faster than munis, and that munis are also up to 75% faster than commercials.
I don’t think “up-to” is a very meaningful metric in this instance.