


Three Surprises in Akamai’s State of the Internet Report
Today Akamai releases the latest edition of its State of the Internet Report, the go-to overview of developments in global Internet infrastructure. This edition covers the 4th quarter of 2015; we’ve covered previous editions here, here, here, here, and here, and we spoke with the author of the report, David Belson, here. This is last of the series that will rely in the somewhat confusing “Average Connection Speed” and “Average Peak Connection Speed” measurements to rank raw speed; the next edition will introduce a different measurement that will hopefully measure Internet user experience in a way that’s more accessible to readers.
The press stumbles badly in its understanding of one measurement that is the average of all TCP connections seen in a region (Average Connection Speed or ACS) vs. another measurement that averages the fastest TCP connections seen from each IP address in the region (Average Peak Connection Speed or APCS.) The most common error is the tendency of writers to compare the average connection speeds of large ISPs with the average peak connection speed of boutique services such as Google fiber. When there’s only one metric they will have no choice but to use it fairly. So while I bemoan the withdrawal of data, I can’t argue with the reasoning.
Akamai’s Surprise Findings
Before I get into the speed (or more precisely, “capacity”) comparisons, I’d like to highlight the things I didn’t expect to see. IPv6 is actually replacing IPv4 in several countries: in the US, India, and Germany Akamai sees the simultaneous increase in IPv6 data requests and decrease in IPv4 requests. This is what happens with one technology overtakes another. It’s not yet a global trend, but IPv6 is on the rise pretty much everywhere. IPv4 is also increasing on a global basis, but very, very slowly.
Another two surprises are in the data as well: the US is doing amazingly well in high speed broadband adoption, and in many nations mobile networks are faster than wired ones. This is even the case in some nations with blazingly fast wired networks. Details on these latter two surprises follow after the Akamai summary.
Akamai’s Overall Summary
Here’s the global snapshot (page 3:)
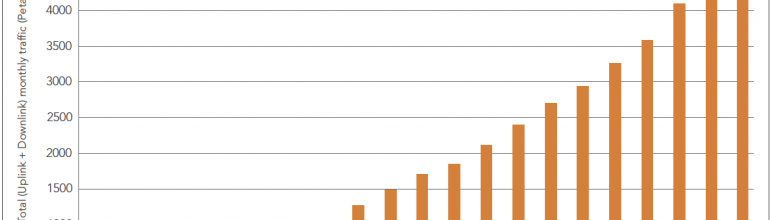
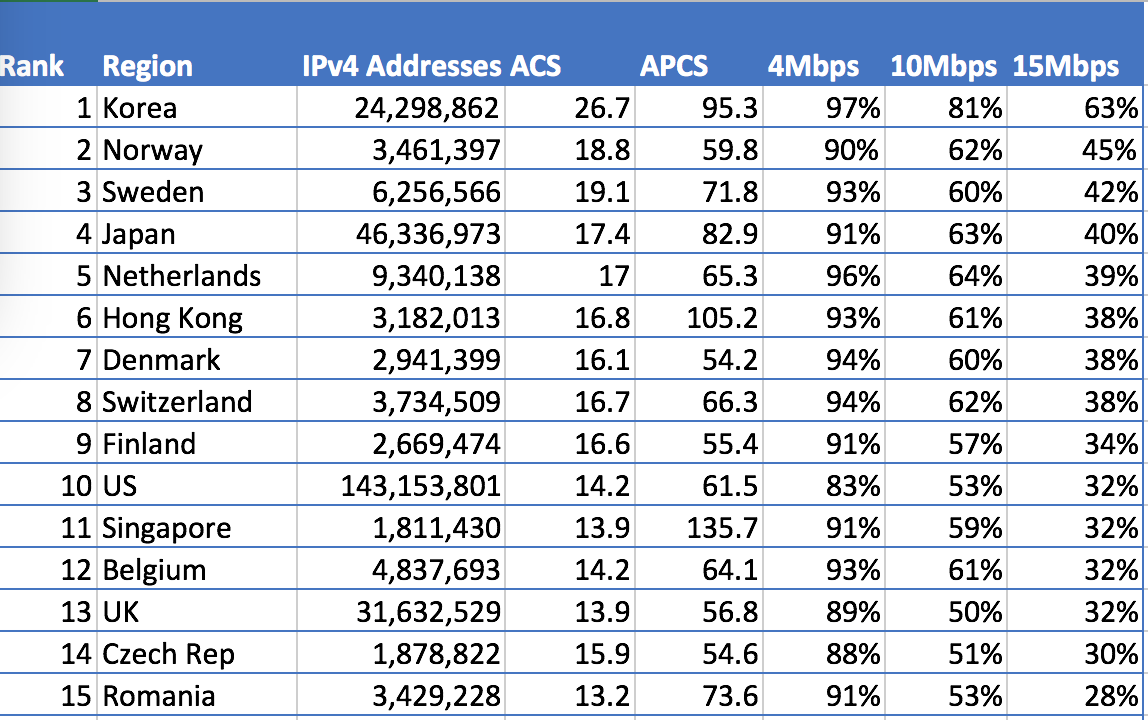
In the fourth quarter of 2015, Akamai observed a 0.2% quarterly increase in the number of unique IPv4 addresses connecting to the Akamai Intelligent Platform, growing to over 810 million — about 1.7 million more than were seen in the third quarter of 2015. Belgium remained the clear global leader in IPv6 adoption with 37% of its connections to Akamai occurring over IPv6, up 6.2% from the previous quarter. The global average connection speed increased 8.6% quarter over quarter to 5.6 Mbps, while the global average peak connection speed increased 1.0% to 32.5 Mbps. At a country/region level, South Korea continued to have the highest average connection speed in the world at 26.7 Mbps, a 30% gain over the third quarter, while Singapore maintained its position as the country with the highest average peak connection speed at 135.7 Mbps, a 0.2% quarterly increase.
Globally, 4 Mbps broadband adoption came in at 69%, up 5.8% from the third quarter, with South Korea as the country with the highest level of adoption at 97%. Unsurprisingly, South Korea once again led the world across the 10 Mbps, 15 Mbps, and 25 Mbps broadband tiers as well, with adoption rates of 81%, 63%, and 37% respectively, after seeing substantial quarterly gains across all three metrics. Global 10 Mbps, 15 Mbps, and 25 Mbps adoption also grew robustly in the fourth quarter, posting gains of 15%, 28%, and 37% at each threshold and reaching adoption levels of 32%, 19%, and 7.1% respectively.
This means that Singapore has the fastest broadband networks in the world, but Korea has a better-developed infrastructure and/or a different mix of applications than Singapore does. Average connection speed declines when people spend more time surfing the web or sharing connections with roommates than playing games or streaming movies over a connection that supports a smaller number of people. Average peak connection speed increases when the last mile connection is faster than all get out.
The adoption rates at different speeds are pegged to average connection speed, so the underlying pipe needs to be three to four times faster than the threshold. To qualify as as greater than 10 Mbps (ACS), the broadband service needs to offer 40 Mbps of APCS. Akamai added a 25 Mbps broadband adoption threshold after FCC Chairman Wheeler raised his target for minimum broadband speed, but there’s so little 25 Mbps adoption in the world that Akamai only examines it very briefly.
Where does the US Stand?
The US standing is all over the place in the different metrics. The nation as a whole ranks 14th in the world in ACS, at 14.2 Mbps. this is a 13% improvement from the third quarter and a 29% improvement over the year. On this pace, ACS doubles in the US every two years, right in line with Moore’s Law.
In terms of APCS, the US ranks 20th, with an average broadband capacity of 61.5 Mbps, a quarterly improvement of 7.2% and an annual improvement of 25%. That’s not bad either. The most interesting ranking is where the US stands in high-speed broadband adoption. The highest rate Akamai reports across the board is the percentage of connections over 15 Mbps, which would generally need broadband plan speeds greater than 50 Mbps.
Akamai State of the Internet Global Ranking
The US ranks tenth in this measurement, tied with Singapore, Belgium, and the UK. This is also surprising because it says that the ability of Americans to use the most bandwidth-intensive Internet applications is on par with the ability of citizens in the nation with the fastest broadband networks. This is a testament to the broad deployment of high-capacity wired networks such as DOCSIS 3 cable, VDSL 2+ (AT&T U-verse), Verizon FiOS, and the boutique networks such as Google Fiber, Sonic, and Webpass. So whatever we’re doing here in terms of policy, we’re not leaving people behind to the extent that most other nations are.
The US figures in mobile aren’t nearly as impressive, but it’s hard to chart them since Akamai doesn’t do any of the heavy lifting in this report. The mobile figures were missing altogether in some of the previous reports, but Akamai has enough confidence to include them this time. I expect the mobile figures will improve over the next year or two. The thing I pay attention to is the relationship of wired to mobile web page load time, and I was surprised to see a large number of countries where mobile is actually much more snappy than wired. Here’s the chart of the Asia Pacific Region from page 48.
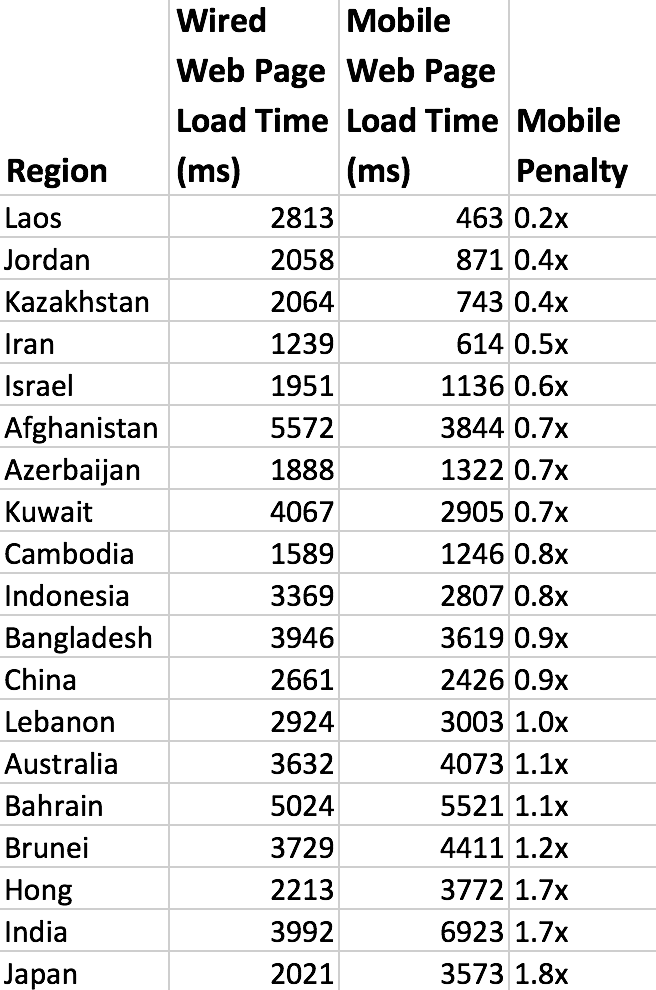
Mobile Penalty From Akamai State of the Internet Report. Less than one means mobile is faster.
In this chart, a “mobile penalty” of less than one means mobile connections are faster than wired ones. You can’t write this off to underdeveloped infrastructure because Israel, Kuwait, Indonesia, and China are among the group where mobile is faster and they have excellent wired networks. Indonesia ranks 6th in APCS, and Chinese regions Hong Kong, Macau, and Mongolia are in the top 10. None of the nations has a high adoption rating for the higher speeds, but there are some fast network connections to be had in all of them.
US States vs. Other Nations
One of the fun things to do with Akamai’s numbers is to see where US states would rank if they were countries. This highlights parts of the US where fast networks are in place due to carrier investment, user demand, or subsidies have been paid for network investment. Here are the nations with the highest APCS.
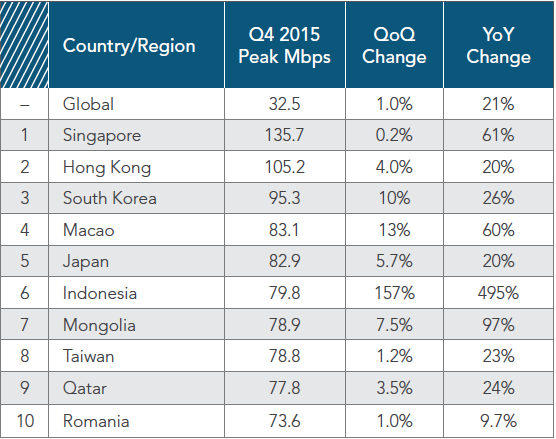
Global APCS Leaders per Akamai State of the Internet
And here are the US States with the highest APCS.
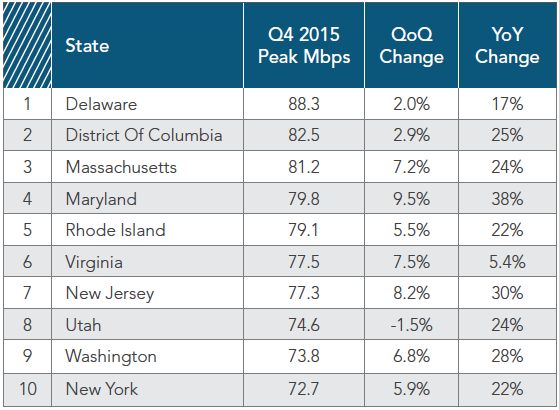
US States with Highest APCS per Akamai State of the Internet
If we combine the rankings, the Top 10 list is as follows:
- Singapore
- Hong Kong
- South Korea
- Delaware
- Macao
- Japan
- District of Columbia
- Massachusetts
- Maryland
Indonesia (tie)
So four of the 10 fastest regions are American states.
Conclusion
The Internet is slowly transitioning from IPv4 to IPv6, some 20 years after the Internet Engineering Task Force selected IPv6 as the next generation packet protocol for the network. Speeds are steadily rising for wired networks, especially in small nations; but middle mile infrastructure isn’t keeping up. In many nations, mobile networks offer higher performance than wired ones, even where wired networks are very, very fast. And in the US, the diffusion of very high speed broadband is keeping pace with the nations with the very highest speeds.
So the State of the Internet is strong, Mr. Speaker.