


Broadband Speed in America, 2015
On December 30th, while nobody was paying attention, the FCC released its long-delayed 2015 edition of its broadband speed test, the Measuring Broadband America Fixed Broadband Report. This is an annual report started in 2011 that was originally meant to hold ISPs’ feet to the fire in terms of the advertising claims they make and the services they deliver. It seemed like a good idea for the agency because its British counterpart, Ofcom, had published a similar report based on the same methodology to embarrass (mostly DSL) ISPs about the more than 50% gap between advertised and actual service speeds. Both the US and the UK use SamKnows, a speed testing service based in the UK that now measures speeds around the world.
While SamKnows found that UK ISPs only delivered much less than promised, US ISPs have always delivered essentially all the speed they’ve advertised, if not more:
…a November 2011 U.K. broadband study (conducted by the U.K. regulator Ofcom with the assistance of SamKnows) revealed an average advertised speed of 16.3 Mbps, with a corresponding average actual speed of 7.6 Mbps—a significant gap between the advertised and actual speed that U.K. consumers experience. By contrast, the most recent U.S. data on actual speed shows that American ISPs deliver on average 96% of advertised speeds during peak intervals, with five ISPs routinely meeting or exceeding advertised rates.
Average Broadband Speed
Today the average overall speed delivered is in in excess of the advertised promise. So if MBA was intended to embarrass US ISPs (as many believe), it’s a failure. Nevertheless, it’s still useful to know what’s happening with our much maligned broadband infrastructure. The TL;DR is that it improves by more than 50% a year, every year. Here’s a chart from the FCC report that shows the averages since the first report in 2011. Look at the right hand cluster to see the average of all ISPs up to Sept. 2014.
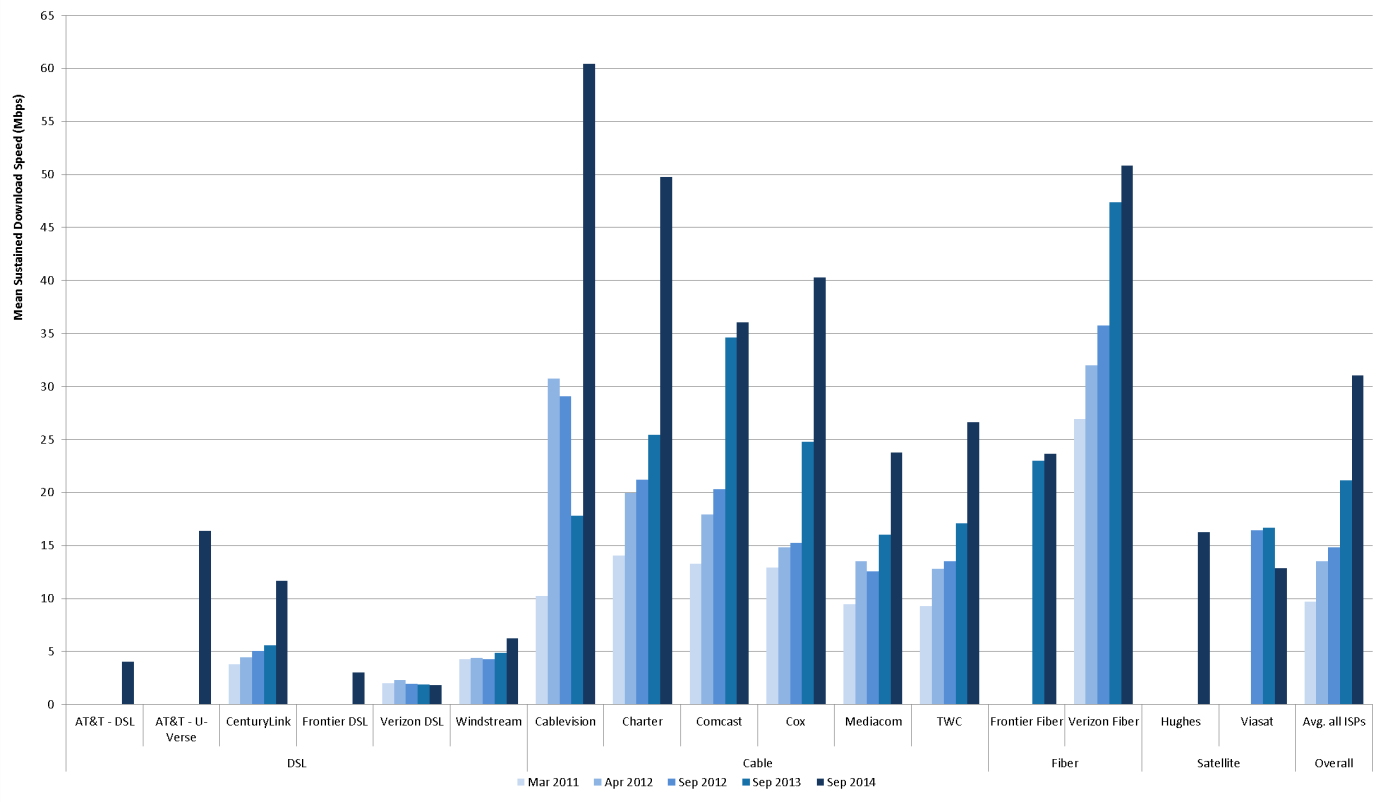
Actual Speed by ISP. Source: FCC MBA 2015 report
So the average download speed for all users of all ISPs in the US was 32 Mbps in September 2014, according to the FCC. This means that the average has more than tripled since the first MBA report, which used March 2011 data. That’s not bad for 3 and a half years, and it’s substantially higher the 10 Mbps average claimed by President Obama (as well as several tech journalists.)
Now some may say this is a dubious figure because the FCC’s data doesn’t really lend itself to either of the two averages presented in this chart: average speed of each ISP and of all ISPs combined. This is a question of sampling. The FCC distributes SamKnows test devices – known as “White Boxes” – to participating homes, and only collects data from those homes. So if the Verizon customers the FCC chooses are actually running at higher speeds than Verizon users as a whole, the FCC’s data can be wrong. Similarly, if the FCC gives too many boxes to Comcast customers, the data can also be wrong. So we have to accept the accuracy of the FCC’s distribution method to consider the figures reliable on the whole. I’m told by people in the know that they work very hard to allocate test boxes correctly, which I believe. But the method still has a sampling weakness.
Verifying Broadband Speed
Consequently, it’s wise to compare the FCC’s data to the only other data set we have for US broadband speed, Akamai’s State of the Internet. We see roughly the same trend in the Akamai data, but at higher average speeds.
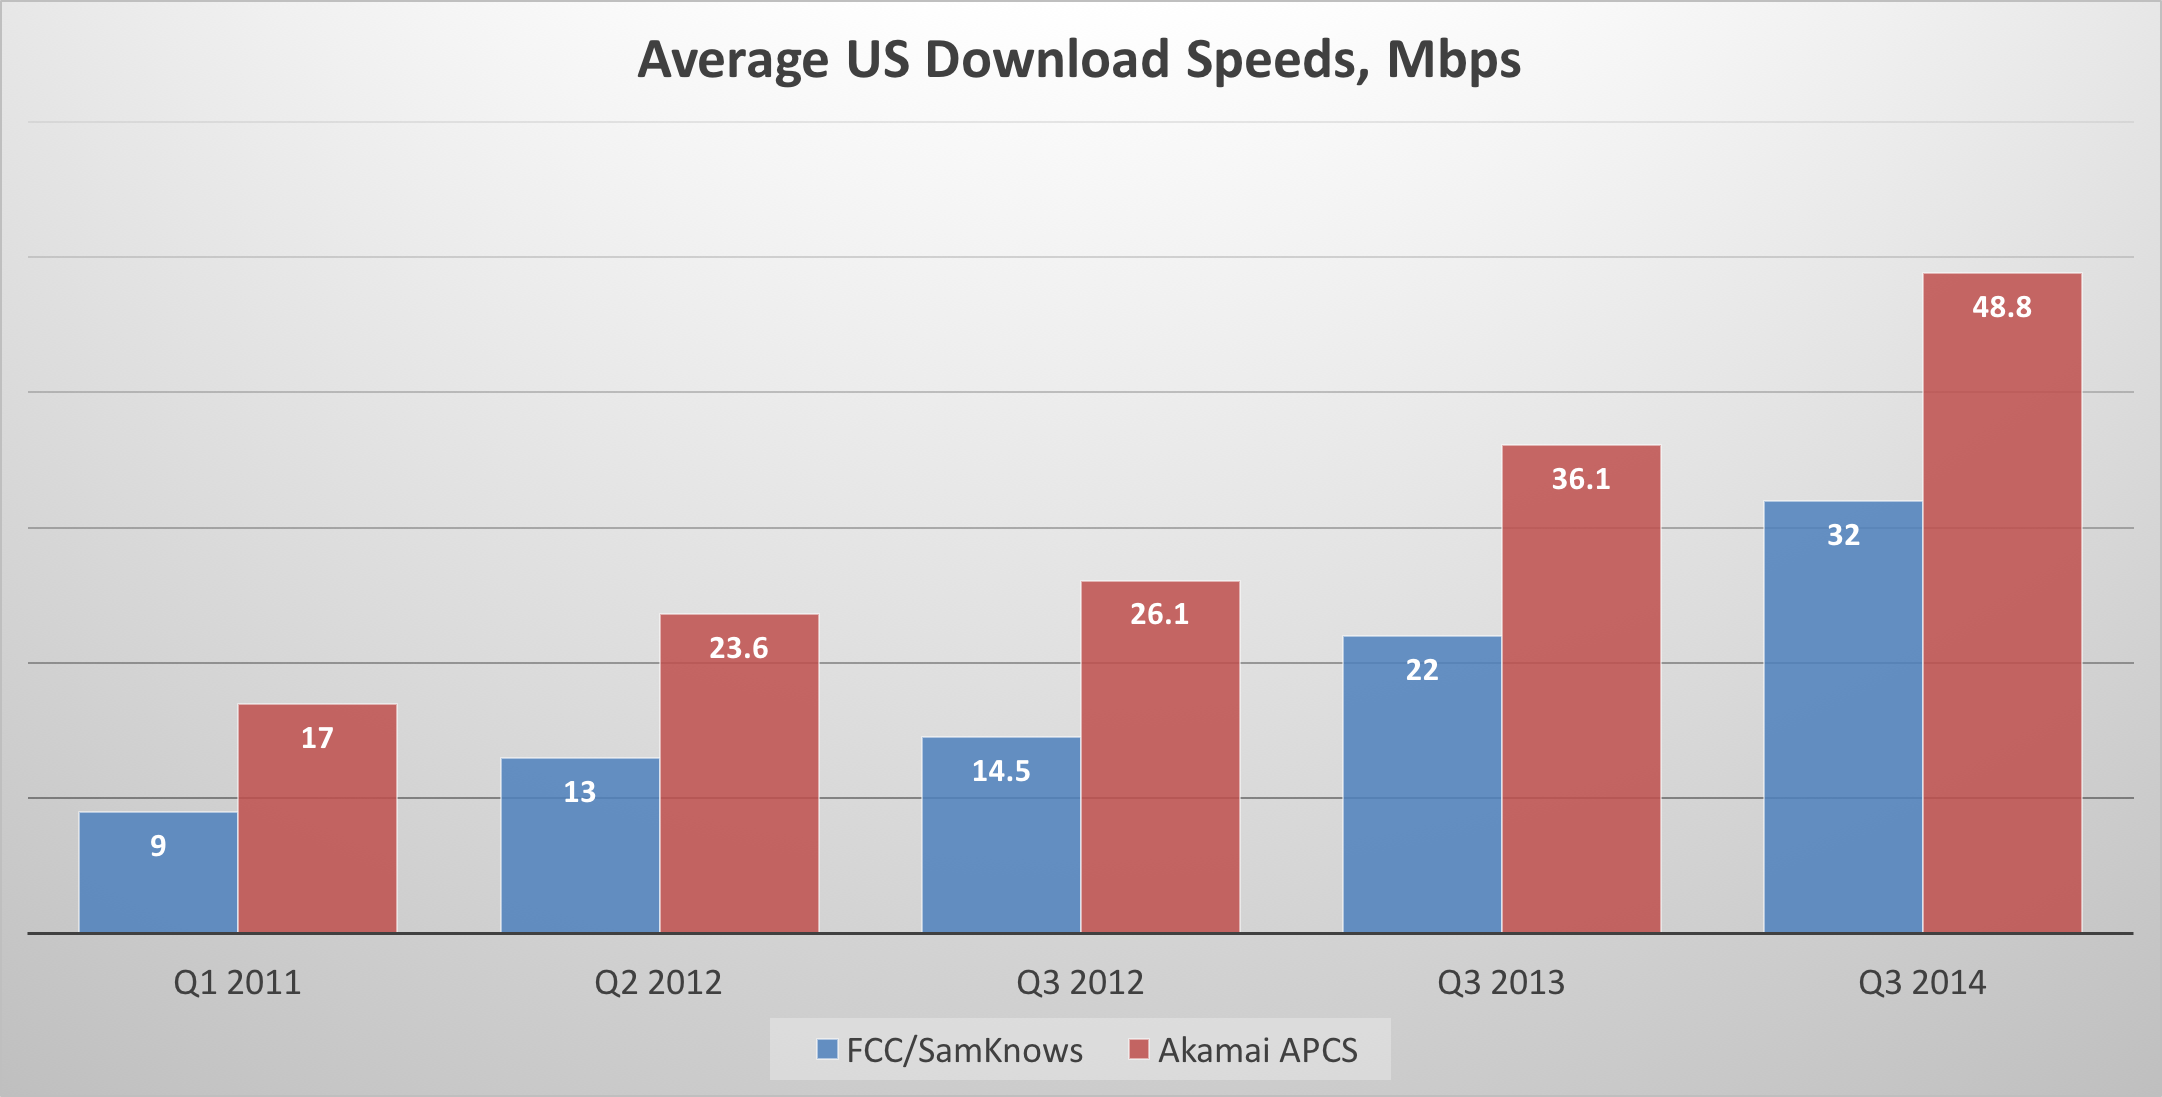
Average Download Speed, FCC vs. Akamai
Akamai says speed increased by 2.9 times between Q1 2011 and Q3 2014, and the FCC says the average rose by 3.6 times. Akamai says the baseline in 2011 was 17 Mbps, while the FCC says it was 9 Mbps. And Akamai says the average download speed rose to 48.8 Mbps by Q3 2014, vs 32 Mbps for the FCC. The measurement techniques are different, the sampling criteria are different, but we see the same general trend line, a tripling in speed over a 3.5 year period.
That’s not bad, obviously. But what does it have to do with application requirements? That’s a more complicated question, obviously, because applications have different needs from the network. The MBA report does a good job of explaining this on page 24:
This Report focuses on three performance metrics that are of particular relevance to consumers of broadband Internet access service: speed, latency, and packet loss. Download and upload speeds are the primary network performance characteristic advertised by ISPs. Actual download speed is the average rate at which information can be downloaded by the consumer. Higher speeds indicate a higher delivery rate. However, as discussed above, the performance observed by a user in any given circumstance depends not only on the actual speed of the ISP’s network, but also on the speed of other parts of the Internet and on the speed of the application itself.
Web Servers Aren’t Keeping up with Broadband Networks
The three performance metrics (speed, latency, and packet loss) reflect roughly the needs of web surfing and video streaming, audio calling, and video calling respectively. The application that’s easiest to characterize is web surfing, and the report reveals a very interesting finding on that front: web surfing hits its sweet spot at 15 Mbps and doesn’t improve much at higher speeds.
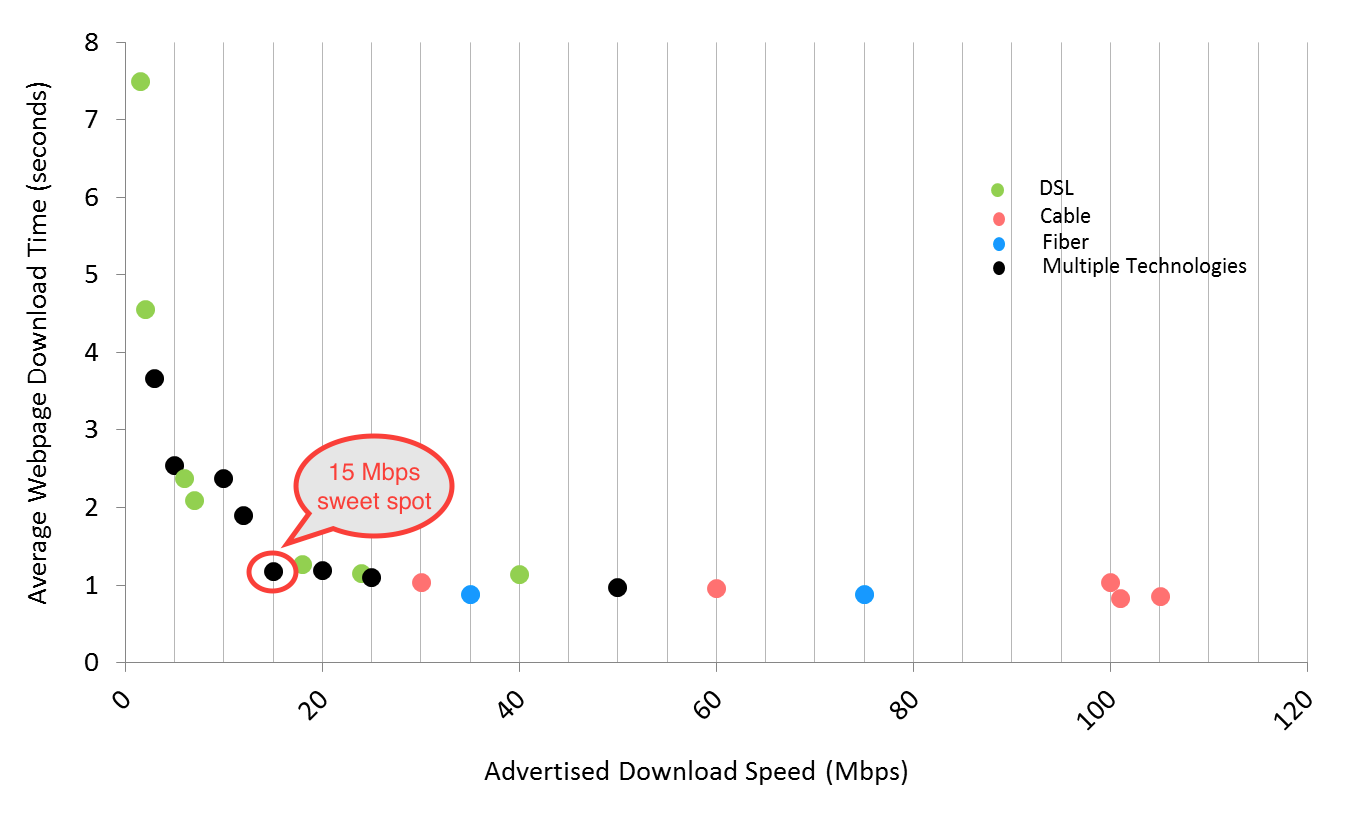
Web Surfing Plateaus at 15 Mbps. Source: FCC
In the last MBA report, the FCC reported that web speeds don’t improve as the broadband pipe goes faster than 10 Mbps, so it appears that web servers are getting faster, even though they lag broadband networks by a staggering degree. If we want faster web surfing, we need web servers than can keep up with broadband networks, which they obviously aren’t doing today.
This is not something we can blame on the ISPs. That’s the clear message in the data, and it couldn’t be any more stark. So why don’t we hear complaints about under-performing web servers? Why doesn’t the FCC have a report dedicated to shaming web sites into boosting their performance when they are clearly holding the Internet back?
I suppose it comes down to promises. Web-based services don’t pitch their brands on the basis of how fast their pages load, and consumers seem to be trained to blame pokey page loads on their ISPs even though that’s a faulty analysis.
I suppose this comes down to Farhad Manjoo’s New Year’s Resolution: For the New Year, Let’s Resolve to Improve Our Tech Literacy:
[T]his year, the techies were right: Technology did rule many issues in 2015. And not only did tech dominate the news, it often moved too quickly for politicians, regulators, law enforcement officials and the media to understand its implications. This year we began to see the creaking evidence of our collective ignorance about the digital age.
I’ll do what I can to help, but all I can do is reveal the data. The rest is up to the media, the regulators and politicians, and to you, gentle reader.
Happy New Year.