


Internet Slowdown Rumor Greatly Exaggerated
The Guardian ran a story on Monday, June 22nd claiming that major US ISPs are slowing traffic speeds for thousands of users. Given that 70 million US households have broadband connections this wouldn’t be such a big deal even if it were true, but headlines like this one have often lead to rash action in Washington. The story is all over Reddit, Raw Story, Yahoo, MSN, and Twitter, so it bears examination even though it looks a bit dubious.
The Guardian sources its claim to a study by “Battle For the Net”, the latest incarnation of Free Press’ “Save the Internet” consortium that secured a major victory with the passage of FCC’s current set of Open Internet regulations. Having succeeded in its Title II campaign, Free Press and its allies are apparently flexing their muscles in an attempt to secure settlement-free peering, which amounts to free transit for the commercial allies (especially content-heavy firms like Amazon, Rackspace, Netflix, Cloudflare, et al.) That’s politics as usual.
The study isn’t public, however. I suspect there is such a study, but either the Guardian broke its embargo or the study is an fundraising document that Free Press and their comrades have put together for their own purposes. We should know which is the case in the next day or two. UPDATE: Here’s the study; it actually indicates interconnection issues between AT&T and GTT, CenturyLink and Tata, and Verizon and GTT in specific locations, not a general trend. [UPDATE 2: Free Press has erased the study they fed the Guardian writer from Google Docs and replaced the content at the link with an altogether new document linking to some blog posts that aren’t very relevant.]
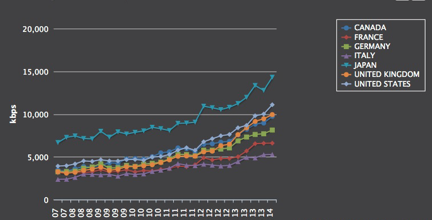
It’s certainly not impossible that Free Press allies in the New America Foundation’s M-Lab program have collected some data indicating a slowdown of sorts in some parts of the Internet over the last few months; as I’ve seen in examining Internet download speeds around the world over the last decade, the path of progress is rarely smooth and uninterrupted. This is because the demand for Internet capacity grows in response to the popularity of applications, but the supply depends in civil engineering, planning, and investment. Sometimes supply grows faster than demand, and sometimes it grows slower.
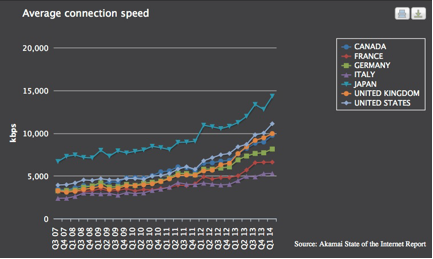
Quarter-by-Quarter Web Speed
There are also indications that investment in wired infrastructure has slowed down in reaction to the FCC’s current regulations, but the slowdown appears to be primarily among smaller ISPs who are squirrelling money away to pay lawyers as Free Press ally Jon Brodkin has heard:
Hohhof is paying off two leases for about $60,000 worth of equipment, and he said it will be hard to justify new borrowing under Title II.
But even that decline isn’t all that significant, at least not yet.
So either Battle for the Net is truthful and accurate or it isn’t. In the past, M-Labs has battled the FCC in its own right over the SamKnows studies the FCC publishes once or twice a year on the question ISP speeds vs. ISP promises. These reports, the Measuring Broadband America series, have shown a pattern of closer alignment between advertised and actual speed that currently shows US ISPs exceeding their promises. This upsets M-Lab, but their criticisms have tended to lack substance. This is the factual status quo that Battle For the Net has to overcome in order to establish its relevance.[UPDATE: M-Lab admits their data doesn’t allow them to determine who’s responsible for congested interconnects: “It is important to note that while we are able to observe and record these episodes of performance degradation, nothing in the data allows us to draw conclusions about who is responsible for the performance degradation.”
While it would be nice to read the study before passing judgment, there are a few things we can see before we examine its reasoning. The Battlers have a web page where you can run their Internet Health Test and see their judgment. You can run the test three times and see how consistent it is, and you can compare the results it delivers with those you’ll get from Speedtest.net, perhaps the most widely used consumer speed testing service. You can also compare your results with those you get from Measurement Lab’s Network Diagnostic Test, but security will be a problem for some.
When I ran Internet Health Test, I captured the packets coming into and out of my computer using a tool called Wireshark that network engineers use to diagnose network issues. If you’re been following Internet policy for a while, you will appreciate that Robb Topolski used Wireshark to determine that Comcast slowed down his darknet file sharing attempts in 2007.
According to the Guardian:
The [Battle For the Net] study, supported by the technologists at Open Technology Institute’s M-Lab, examines the comparative speeds of Content Delivery Networks (CDNs), which shoulder some of the data load for popular websites.
But the Internet Health Test doesn’t actually measure CDNs. When I’ve run the test, my speeds have ranged from 16 Mbps to 27 Mbps, to 42 Mbps, and close to 100 Mbps. While the test is supposed to score performance on interconnections between my ISP and the rest of the Internet, Wireshark says all the testing takes place between my computer and two M-Lab servers with domain names indicating they’re in Denver, ndt.iupui.mlab2.den04.measurement-lab.org (IP address 128.177.109.88) and ndt.iupui.mlab1.den01.measurement-lab.org (IP address 184.105.23.75.) This is misleading, however, because they’re actually much farther away.
IP location services say these servers are in Above Net’s data center in White Plains, New York and in Hurricane Electric’s network in Fremont, CA; their ping times reinforce this theory as they run about 55 ms to California and 65 ms to New York. [Added: But traceroute says 128.177.109.88 is in Denver, on a network operated by Zayo/Abovenet that interconnects in Dallas, and 184.105.23.75 is also in Denver, on another route that also goes from Denver to Dallas before coming back to Denver; it’s on a network operated by Hurricane Electric. In either case, Comcast provides transit from Dallas and Denver for the test servers whose ping times are as long as they would be to servers located on the coasts. Traceroutes are attached to the end of the post. Even though Comcast doesn’t interconnect with HE and Zayo/Abovenet in Denver, the rational person would measure to the nearest interconnection point, not a dogleg route. M-Lab should use servers in Dallas for this test.]
I’m perplexed that M-Lab would only measure two long, convoluted paths through the Internet when there are dozens of potential interconnection locations in the US. The Speedtest server, which is inside my ISP’s network, is less than 30 ms away and on the Internet closer means faster. Both near and far locations are biased, so the reasonable approach would be a mix of the two. You certainly don’t get insight into CDNs by choosing long paths because CDNs are always as close as possible. While there are good reasons to test long paths, determining CDN performance isn’t one of them. CDNs are always as close as possible by design.
I’ve run the tests several times and these are the only servers (high-volume sources or destinations) I see. These are the same servers that run the M-Lab Network Diagnostic Test that shows my connection bouncing around from 25 to 100 Mbps. Speedtest to the default server in Denver shows my connection to be a consistent result, 115 Mbps. Others see similar discrepancies between Speedtest and M-Lab testing.
On Twitter, Brian Fung of the Washington Post speculates that Speedtest is more limited than M-Lab:

And this is what Wireshark says, in a sense: the M-Labs servers are remote, while the Speedtest default server is local. But you can choose alternate servers with Speedtest, something Battle for the Net won’t let you do. This doesn’t actually measure interconnection per se; it’s more like a worst case scenario.
In summary, it appears that Battle for the Net may have cooked up some dubious tests to support their predetermined conclusion that ISPs are engaging in evil, extortionate behavior.
It may well be the case that they want to, but AT&T, Verizon, Charter Cable, Time Warner Cable, Brighthouse, and several others have merger business and spectrum auction business pending before the FCC. If they were manipulating customer experience in such a malicious way during the pendency of the their critical business, that would constitute executive ineptitude on an enormous scale. The alleged behavior doesn’t make customers stick around either.
I doubt the ISPs are stupid enough to do what the Guardian says they’re doing, and a careful examination of the available test data says that Battle for the Net is actually cooking the books. There is no way a long haul bandwidth and latency test says a thing about CDN performance. Now it could be that Battle for the Net has as a secret test that actually measures CDNs, but if so it’s certainly a well-kept one. Stay tuned.
[Update: Here are the traceroutes that show how the test traffic is routed from Denver to Dallas and back to Denver before reaching the test server. This path is probably repeated on the other side, but traceroute doesn’t let me see it.
To Zayo:
3 xe-9-0-0-0-sur03.wheatridge.co.denver.comcast.net (68.85.107.5) 19.656 ms 18.566 ms 20.113 ms
4 ae-10-0-sur02.wheatridge.co.denver.comcast.net (162.151.51.42) 12.056 ms 44.858 ms 20.839 ms
5 ae-30-0-ar01.aurora.co.denver.comcast.net (162.151.51.17) 28.719 ms 17.265 ms 12.878 ms
6 he-0-5-0-0-cr02.denver.co.ibone.comcast.net (68.86.90.149) 23.136 ms
he-0-5-0-2-cr02.denver.co.ibone.comcast.net (68.86.92.25) 17.202 ms
he-0-5-0-0-cr02.denver.co.ibone.comcast.net (68.86.90.149) 27.006 ms
7 be-11317-cr01.dallas.tx.ibone.comcast.net (68.86.84.229) 43.089 ms 36.500 ms 33.875 ms
8 he-0-11-0-1-pe03.1950stemmons.tx.ibone.comcast.net (68.86.86.130) 35.940 ms 40.040 ms 41.074 ms
9 ae13.er1.dfw2.us.zip.zayo.com (64.125.13.185) 34.702 ms 38.355 ms 40.094 ms
10 ae8.er2.dfw2.us.zip.zayo.com (64.125.29.122) 35.837 ms
ae11.cr1.dfw2.us.zip.zayo.com (64.125.20.65) 40.621 ms
ae8.er2.dfw2.us.zip.zayo.com (64.125.29.122) 31.117 ms
11 ae5.cr2.dfw2.us.zip.zayo.com (64.125.20.206) 38.207 ms 39.547 ms 40.088 ms
12 ae6.mpr2.den1.us.zip.zayo.com (64.125.31.58) 55.607 ms 56.817 ms 71.488 ms
13 128.177.109.88.ipyx-096968-004-zyo.zip.zayo.com (128.177.109.88) 60.086 ms 49.842 ms 50.140 ms
To Hurricane Electric:
3 xe-9-0-0-0-sur03.wheatridge.co.denver.comcast.net (68.85.107.5) 21.687 ms 18.123 ms 19.796 ms
4 ae-30-0-ar01.denver.co.denver.comcast.net (162.151.51.9) 17.706 ms 19.875 ms 20.175 ms
5 he-6-1-3-cr01.1601milehigh.co.ibone.comcast.net (68.86.93.5) 20.310 ms 19.681 ms
he-6-1-1-cr01.1601milehigh.co.ibone.comcast.net (68.86.87.117) 27.215 ms
6 he-0-3-0-0-cr02.denver.co.ibone.comcast.net (68.86.86.189) 17.069 ms
he-0-3-0-2-cr02.denver.co.ibone.comcast.net (68.86.85.193) 20.239 ms
he-0-3-0-1-cr02.denver.co.ibone.comcast.net (68.86.86.193) 19.726 ms
7 be-11317-cr01.dallas.tx.ibone.comcast.net (68.86.84.229) 33.158 ms 31.605 ms 31.839 ms
8 he-0-12-0-0-pe03.1950stemmons.tx.ibone.comcast.net (68.86.86.178) 28.305 ms 30.623 ms 36.492 ms
9 50-248-117-6-static.hfc.comcastbusiness.net (50.248.117.6) 40.001 ms 36.598 ms 40.152 ms
10 10ge5-3.core1.mci3.he.net (184.105.222.9) 50.112 ms 60.032 ms 42.156 ms
11 10ge15-4.core1.den1.he.net (184.105.222.21) 57.731 ms 53.554 ms 74.696 ms
12 184.105.23.75 (184.105.23.75) 68.651 ms 69.499 ms 57.584 ms
Consequently, M-Lab is actually measuring performance on the Dallas->Denver routes solely owned and operated by Hurricane and Abovenet and passing off the results as indications of my ISP’s performance. That’s downright phony. ]