


Open Internet Orders Degrade Internet Improvement
This is a followup on my post about claims that broadband speeds got a bump from the FCC’s 2015 Open Internet Order. That post included a table with all the relevant data, but it’s easier to visualize with charts. Clearly, the orders degraded the rate of improvement in broadband Internet service in the US.
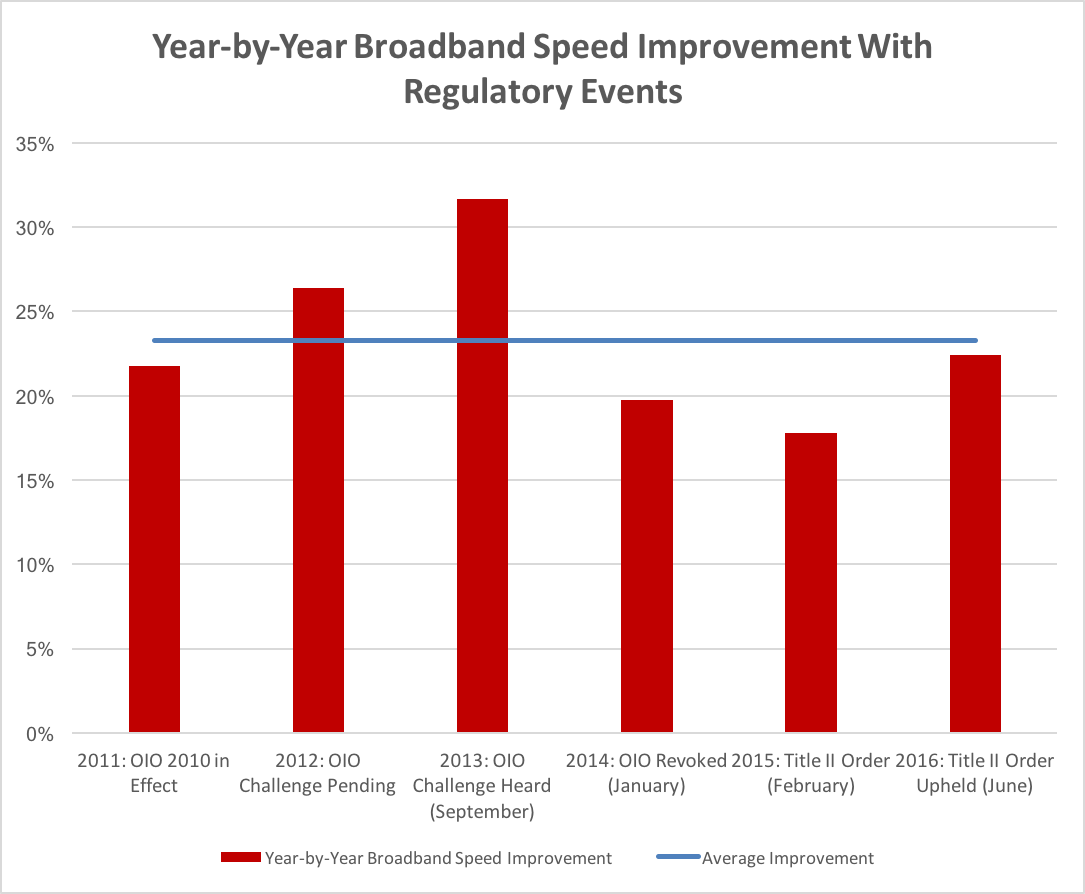
The data is each year’s average peak connection speed, taken from Akamai’s State of the Internet report. This figure is the average of all four quarterly improvements in the year compared to the corresponding average for the previous year.
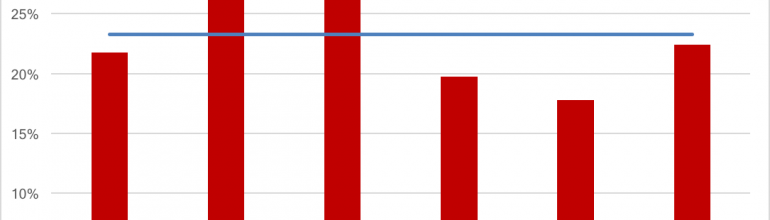
The average annual improvement from 2010 to 2016 is 23 percent, represented by the blue line running horizontally.
2010 Data Has Problems and Was Omitted
I’ve omitted the data for 2010, when the rate of improvement was -5%, because the 2010 Open Internet Order wasn’t passed until December. There was a lot of fear on 2010 that a Title II order was on the offing, based on language in the NPRM.
The first quarter of 2010 saw a 9% decline in speed from the first quarter of 2009. The second quarter was even worse, declining 49%.
A decline this sharp suggests a problem in the underlying data set because it’s a complete outlier; speeds have always improved except for 2010. So I start the averages with 2011, when the 2010 OIO took effect and was challenged.
Nothing Spurs Improvement Like a Court Challenge
The rates of improvement graph suggests that nothing stimulates broadband speed improvement like a court challenge. The best three years span 2011-2013, the time when the 2010 Order was under review. The average for this period was 28%, while the overall average was 23% as noted.
The passage of 2015 OIO led to an immediate decline to 18 percent for 2015 and a slight recovery to 22%. But the average improvement since the 2015 order passed is 20%, less than the overall 23% average.
The best two years for US broadband improvement were 2012 and 2013, the when the 2010 order was under review by the DC Circuit Court. The improvements in these years were 26% and 32%. With a two-year average improvement of 29%, these were the good old days.
Nothing Retards Improvement Like an Open Internet Order
In the years when new Open Internet Orders took effect, 2011 and 2015, sharp declines in broadband improvement were the order of the day, a below average 22% in 2011 and a sharply below average 18% in 2015.
Even when the figures for 2016 are taken into account, the numbers show very clearly that Open Internet Orders are a drag on the rate of broadband improvement in the US. The numbers also show that the Title II order did more damage than the 2010 Title I order.
We want our broadband speeds to improve. The data show that the best way to make that happen is to challenge open Internet orders, especially those that classify broadband Internet service under Title II.